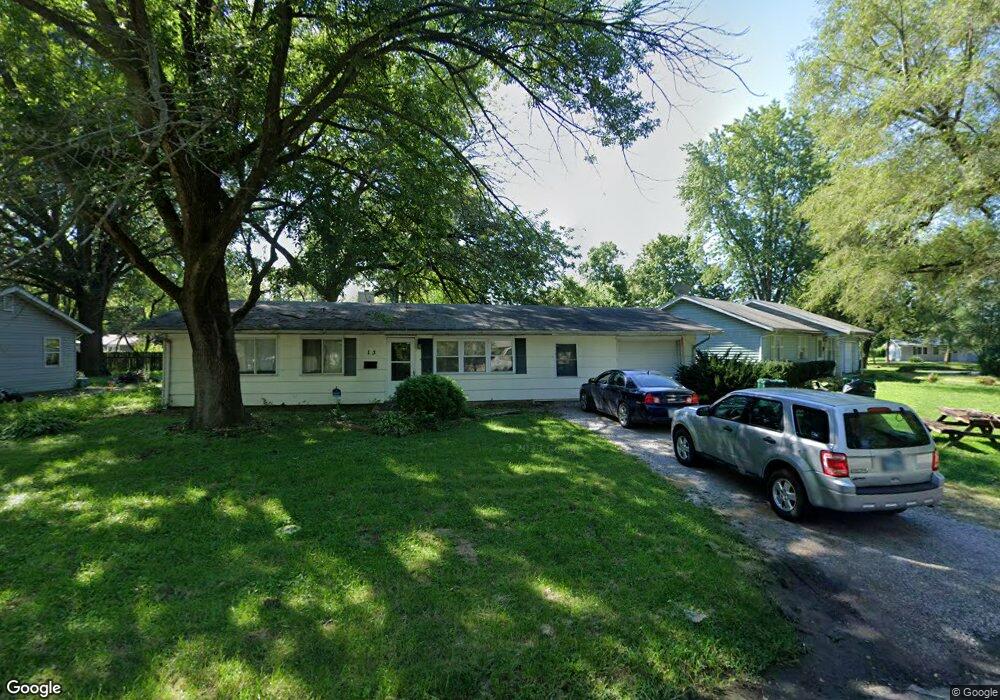
13 W Adams Dr East Saint Louis, IL 62206
Estimated Value: $76,000 - $85,000
--
Bed
--
Bath
1,100
Sq Ft
$72/Sq Ft
Est. Value
About This Home
This home is located at 13 W Adams Dr, East Saint Louis, IL 62206 and is currently estimated at $79,670, approximately $72 per square foot. 13 W Adams Dr is a home located in St. Clair County.
Ownership History
Date
Name
Owned For
Owner Type
Purchase Details
Closed on
Apr 3, 2023
Sold by
Greenstreet Investments Inc
Bought by
Jelinek Scott and Jecniv Trust
Current Estimated Value
Home Financials for this Owner
Home Financials are based on the most recent Mortgage that was taken out on this home.
Original Mortgage
$300,000
Outstanding Balance
$291,226
Interest Rate
6.32%
Mortgage Type
New Conventional
Estimated Equity
-$211,556
Purchase Details
Closed on
Mar 31, 2023
Sold by
Stevens Roland B
Bought by
Greenstreet Investments Inc
Home Financials for this Owner
Home Financials are based on the most recent Mortgage that was taken out on this home.
Original Mortgage
$300,000
Outstanding Balance
$291,226
Interest Rate
6.32%
Mortgage Type
New Conventional
Estimated Equity
-$211,556
Purchase Details
Closed on
Jul 9, 1999
Bought by
Stevens Roland Tr
Create a Home Valuation Report for This Property
The Home Valuation Report is an in-depth analysis detailing your home's value as well as a comparison with similar homes in the area
Home Values in the Area
Average Home Value in this Area
Purchase History
| Date | Buyer | Sale Price | Title Company |
|---|---|---|---|
| Jelinek Scott | $256,500 | Accent Title | |
| Greenstreet Investments Inc | $280,000 | None Available | |
| Stevens Roland Tr | $12,500 | -- |
Source: Public Records
Mortgage History
| Date | Status | Borrower | Loan Amount |
|---|---|---|---|
| Open | Jelinek Scott | $300,000 | |
| Closed | Greenstreet Investments Inc | $32,000 |
Source: Public Records
Tax History Compared to Growth
Tax History
| Year | Tax Paid | Tax Assessment Tax Assessment Total Assessment is a certain percentage of the fair market value that is determined by local assessors to be the total taxable value of land and additions on the property. | Land | Improvement |
|---|---|---|---|---|
| 2024 | $2,137 | $11,171 | $1,342 | $9,829 |
| 2023 | $1,930 | $10,097 | $1,213 | $8,884 |
| 2022 | $1,760 | $8,849 | $1,063 | $7,786 |
| 2021 | $1,839 | $8,385 | $1,007 | $7,378 |
| 2020 | $1,971 | $8,298 | $1,055 | $7,243 |
| 2019 | $2,008 | $8,298 | $1,055 | $7,243 |
| 2018 | $1,997 | $8,419 | $1,070 | $7,349 |
| 2017 | $1,998 | $8,216 | $1,044 | $7,172 |
| 2016 | $2,102 | $8,186 | $1,040 | $7,146 |
| 2014 | $1,741 | $8,097 | $1,029 | $7,068 |
| 2013 | $2,244 | $7,595 | $965 | $6,630 |
Source: Public Records
Map
Nearby Homes