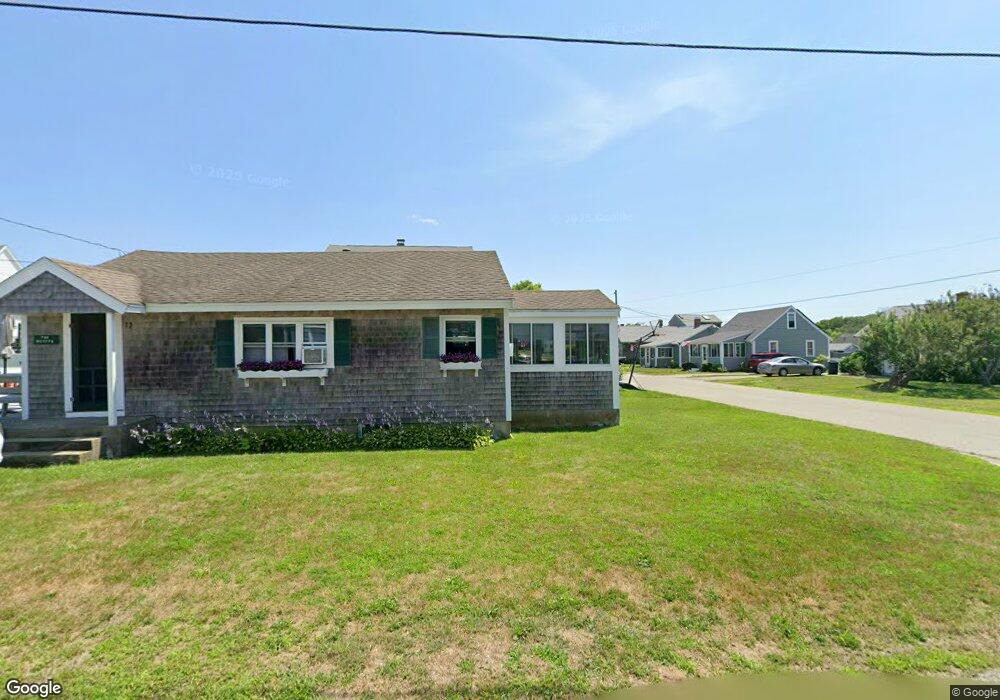
13 W Brook St Marshfield, MA 02050
Ocean Bluff-Brant Rock NeighborhoodEstimated Value: $489,000 - $650,000
2
Beds
1
Bath
832
Sq Ft
$660/Sq Ft
Est. Value
About This Home
This home is located at 13 W Brook St, Marshfield, MA 02050 and is currently estimated at $549,457, approximately $660 per square foot. 13 W Brook St is a home with nearby schools including Daniel Webster, Furnace Brook Middle School, and Marshfield High School.
Ownership History
Date
Name
Owned For
Owner Type
Purchase Details
Closed on
Feb 27, 2025
Sold by
Duffy Cottage T and Duffy D
Bought by
Barbara L Duffy Ret and Duffy
Current Estimated Value
Purchase Details
Closed on
Sep 26, 2013
Sold by
Duffy Barbara L
Bought by
Duffy Cottage T and Duffy D
Purchase Details
Closed on
May 31, 1996
Sold by
Burke Ann T
Bought by
Conway Robert A
Home Financials for this Owner
Home Financials are based on the most recent Mortgage that was taken out on this home.
Original Mortgage
$120,000
Interest Rate
7.91%
Mortgage Type
Purchase Money Mortgage
Create a Home Valuation Report for This Property
The Home Valuation Report is an in-depth analysis detailing your home's value as well as a comparison with similar homes in the area
Home Values in the Area
Average Home Value in this Area
Purchase History
| Date | Buyer | Sale Price | Title Company |
|---|---|---|---|
| Barbara L Duffy Ret | -- | None Available | |
| Barbara L Duffy Ret | -- | None Available | |
| Duffy Cottage T | -- | -- | |
| Duffy Cottage T | -- | -- | |
| Conway Robert A | $170,000 | -- | |
| Conway Robert A | $170,000 | -- |
Source: Public Records
Mortgage History
| Date | Status | Borrower | Loan Amount |
|---|---|---|---|
| Previous Owner | Conway Robert A | $120,000 |
Source: Public Records
Tax History Compared to Growth
Tax History
| Year | Tax Paid | Tax Assessment Tax Assessment Total Assessment is a certain percentage of the fair market value that is determined by local assessors to be the total taxable value of land and additions on the property. | Land | Improvement |
|---|---|---|---|---|
| 2025 | $4,239 | $428,200 | $318,000 | $110,200 |
| 2024 | $4,178 | $402,100 | $298,100 | $104,000 |
| 2023 | $3,985 | $354,000 | $268,300 | $85,700 |
| 2022 | $3,985 | $307,700 | $228,500 | $79,200 |
| 2021 | $3,826 | $290,100 | $218,600 | $71,500 |
| 2020 | $3,419 | $256,500 | $188,800 | $67,700 |
| 2019 | $3,380 | $252,600 | $188,800 | $63,800 |
| 2018 | $3,377 | $252,600 | $188,800 | $63,800 |
| 2017 | $3,187 | $232,300 | $178,900 | $53,400 |
| 2016 | $3,086 | $222,300 | $168,900 | $53,400 |
| 2015 | $2,954 | $222,300 | $168,900 | $53,400 |
| 2014 | $3,049 | $229,400 | $168,900 | $60,500 |
Source: Public Records
Map
Nearby Homes