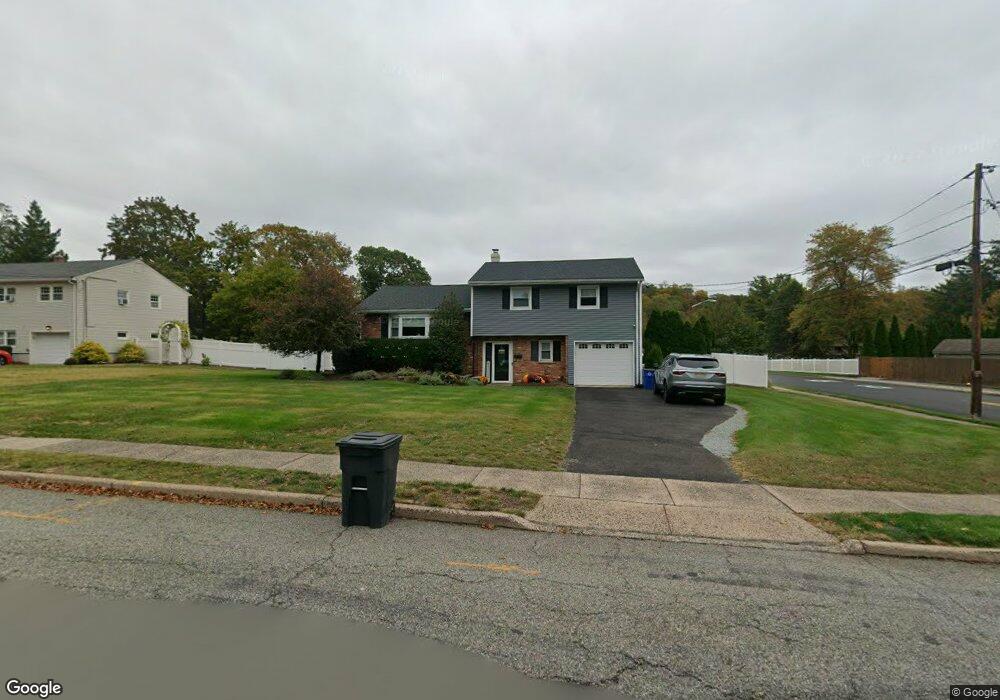
13 W Saddle River Rd Waldwick, NJ 07463
Estimated Value: $803,000 - $866,081
Studio
--
Bath
1,798
Sq Ft
$462/Sq Ft
Est. Value
About This Home
This home is located at 13 W Saddle River Rd, Waldwick, NJ 07463 and is currently estimated at $831,520, approximately $462 per square foot. 13 W Saddle River Rd is a home located in Bergen County with nearby schools including Waldwick High School, Waldwick Seventh-Day Adventist School, and Alpine Learning Group.
Ownership History
Date
Name
Owned For
Owner Type
Purchase Details
Closed on
Feb 8, 2013
Sold by
Sabo Paul W and Sabo Paul
Bought by
Sabo Paul W and Sabo Allison J
Current Estimated Value
Home Financials for this Owner
Home Financials are based on the most recent Mortgage that was taken out on this home.
Original Mortgage
$443,691
Interest Rate
3.44%
Mortgage Type
FHA
Purchase Details
Closed on
Oct 24, 2008
Sold by
Cottone Christine M and Bocchiaro Christine M
Bought by
Sabo Paul and Sabo Allison
Purchase Details
Closed on
Sep 21, 2000
Bought by
Cottone Christine
Home Financials for this Owner
Home Financials are based on the most recent Mortgage that was taken out on this home.
Original Mortgage
$95,000
Interest Rate
7.81%
Create a Home Valuation Report for This Property
The Home Valuation Report is an in-depth analysis detailing your home's value as well as a comparison with similar homes in the area
Home Values in the Area
Average Home Value in this Area
Purchase History
| Date | Buyer | Sale Price | Title Company |
|---|---|---|---|
| Sabo Paul W | -- | -- | |
| Sabo Paul | $500,000 | -- | |
| Cottone Christine | -- | -- | |
| Cottone Christine | -- | -- |
Source: Public Records
Mortgage History
| Date | Status | Borrower | Loan Amount |
|---|---|---|---|
| Previous Owner | Sabo Paul W | $443,691 | |
| Previous Owner | Cottone Christine | $95,000 |
Source: Public Records
Tax History
| Year | Tax Paid | Tax Assessment Tax Assessment Total Assessment is a certain percentage of the fair market value that is determined by local assessors to be the total taxable value of land and additions on the property. | Land | Improvement |
|---|---|---|---|---|
| 2025 | $14,333 | $647,400 | $359,400 | $288,000 |
| 2024 | $13,964 | $647,400 | $359,400 | $288,000 |
| 2023 | $13,676 | $480,200 | $320,800 | $159,400 |
| 2022 | $13,676 | $480,200 | $320,800 | $159,400 |
| 2021 | $13,417 | $480,200 | $320,800 | $159,400 |
| 2020 | $13,287 | $480,200 | $320,800 | $159,400 |
| 2019 | $13,282 | $480,200 | $320,800 | $159,400 |
| 2018 | $12,865 | $480,200 | $320,800 | $159,400 |
| 2017 | $12,754 | $480,200 | $320,800 | $159,400 |
| 2016 | $13,010 | $500,000 | $320,800 | $179,200 |
| 2015 | $12,860 | $500,000 | $320,800 | $179,200 |
| 2014 | $12,550 | $500,000 | $320,800 | $179,200 |
Source: Public Records
Map
Nearby Homes
- 9 E Saddle River Rd
- 12 E Saddle River Rd
- 121 Jacquelin Ave
- 24 Sutton Dr
- 2 Chestnut Ridge Rd
- 124 E Prospect St
- 19 Powder Hill Rd
- 724 W Saddle River Rd
- 96 Grove St
- 409 Warren Ave
- 92 Arbor Dr
- 51 Chestnut Ridge Rd
- 8 Adams Rd
- 813 E Saddle River Rd
- 98 E Saddle River Rd
- 22 Knollwood Dr
- 101 Highwood Ave
- 103 Highwood Ave
- 15 N Church Rd
- 10 Werimus Brook Rd
- 15 W Saddle River Rd
- 9 W Saddle River Rd
- 8 W Saddle River Rd
- 6 W Saddle River Rd
- 19 W Saddle River Rd
- 4 Ackerman St
- 5 Malcolm St
- 14 W Saddle River Rd
- 9 Malcolm St
- 4 W Saddle River Rd
- 14 Rustic Dr
- 16 W Saddle River Rd
- 6 Stuart St
- 8 Ackerman St
- 5 W Saddle River Rd
- 11 Malcolm St
- 18 W Saddle River Rd
- 7 Stuart St
- 8 Stuart St
- 15 Malcolm St
Your Personal Tour Guide
Ask me questions while you tour the home.