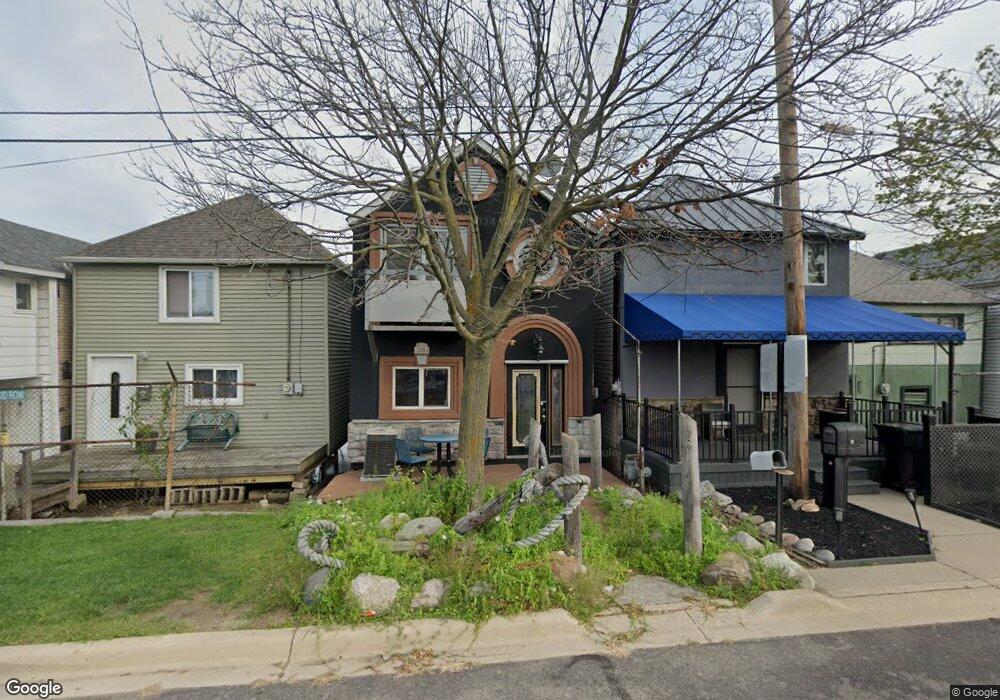
13 Walnut St Wyandotte, MI 48192
Estimated Value: $128,000 - $170,000
--
Bed
--
Bath
1,122
Sq Ft
$139/Sq Ft
Est. Value
About This Home
This home is located at 13 Walnut St, Wyandotte, MI 48192 and is currently estimated at $155,659, approximately $138 per square foot. 13 Walnut St is a home located in Wayne County with nearby schools including James A. Garfield Elementary School, Woodrow Wilson School, and Roosevelt High School.
Ownership History
Date
Name
Owned For
Owner Type
Purchase Details
Closed on
Apr 28, 2022
Sold by
Trinity Land Holdings Llc
Bought by
Ned Properties Llc
Current Estimated Value
Purchase Details
Closed on
Oct 20, 2021
Sold by
Trinity Land Holdings Llc
Bought by
Ned Properties Llc
Home Financials for this Owner
Home Financials are based on the most recent Mortgage that was taken out on this home.
Original Mortgage
$100,000
Interest Rate
2.8%
Mortgage Type
Land Contract Argmt. Of Sale
Purchase Details
Closed on
May 1, 2020
Sold by
Kassem Mike
Bought by
Trinity Land Holdings Llc
Purchase Details
Closed on
Sep 25, 2019
Sold by
Pilon Cynthia and Sgro Melinda
Bought by
Kassem Mike
Purchase Details
Closed on
Dec 21, 2016
Sold by
Cousineau Henry and Cousineau Cynthia
Bought by
Bednarski Marion
Create a Home Valuation Report for This Property
The Home Valuation Report is an in-depth analysis detailing your home's value as well as a comparison with similar homes in the area
Home Values in the Area
Average Home Value in this Area
Purchase History
| Date | Buyer | Sale Price | Title Company |
|---|---|---|---|
| Ned Properties Llc | $100,000 | Michigan Title Insurance Agenc | |
| Ned Properties Llc | $100,000 | None Available | |
| Trinity Land Holdings Llc | -- | None Available | |
| Kassem Mike | $50,000 | Michigan Title Ins Agcy Inc | |
| Bednarski Marion | -- | None Available |
Source: Public Records
Mortgage History
| Date | Status | Borrower | Loan Amount |
|---|---|---|---|
| Previous Owner | Ned Properties Llc | $100,000 |
Source: Public Records
Tax History Compared to Growth
Tax History
| Year | Tax Paid | Tax Assessment Tax Assessment Total Assessment is a certain percentage of the fair market value that is determined by local assessors to be the total taxable value of land and additions on the property. | Land | Improvement |
|---|---|---|---|---|
| 2025 | $3,113 | $71,500 | $0 | $0 |
| 2024 | $3,113 | $68,200 | $0 | $0 |
| 2023 | $2,968 | $59,900 | $0 | $0 |
| 2022 | $3,815 | $52,900 | $0 | $0 |
| 2021 | $3,217 | $50,200 | $0 | $0 |
| 2020 | $3,020 | $41,500 | $0 | $0 |
| 2019 | $3,097 | $42,400 | $0 | $0 |
| 2018 | $2,988 | $51,200 | $0 | $0 |
| 2017 | $1,388 | $51,200 | $0 | $0 |
| 2016 | $2,665 | $58,200 | $0 | $0 |
| 2015 | $3,588 | $54,000 | $0 | $0 |
| 2013 | $3,476 | $49,400 | $0 | $0 |
| 2012 | $1,656 | $49,400 | $25,000 | $24,400 |
Source: Public Records
Map
Nearby Homes
- 2240 Biddle Ave
- 117 Walnut St
- 126 Poplar St
- 20 Chestnut St Unit 401 & 408
- 20 Chestnut St
- 2116 Biddle Ave
- 2842 Van Alstyne St Unit 14
- 2821 Biddle Ave Unit 38
- 2870 Van Alstyne St Unit 23
- 2851 Biddle Ave
- 254 Cedar St
- 225 Superior Blvd
- 166 Oak St
- 166 Oak St Unit 4
- 250 Chestnut St
- 225 Oak St
- 1759 2nd St
- 2619 5th St
- 1756 2nd St
- 682 4th St