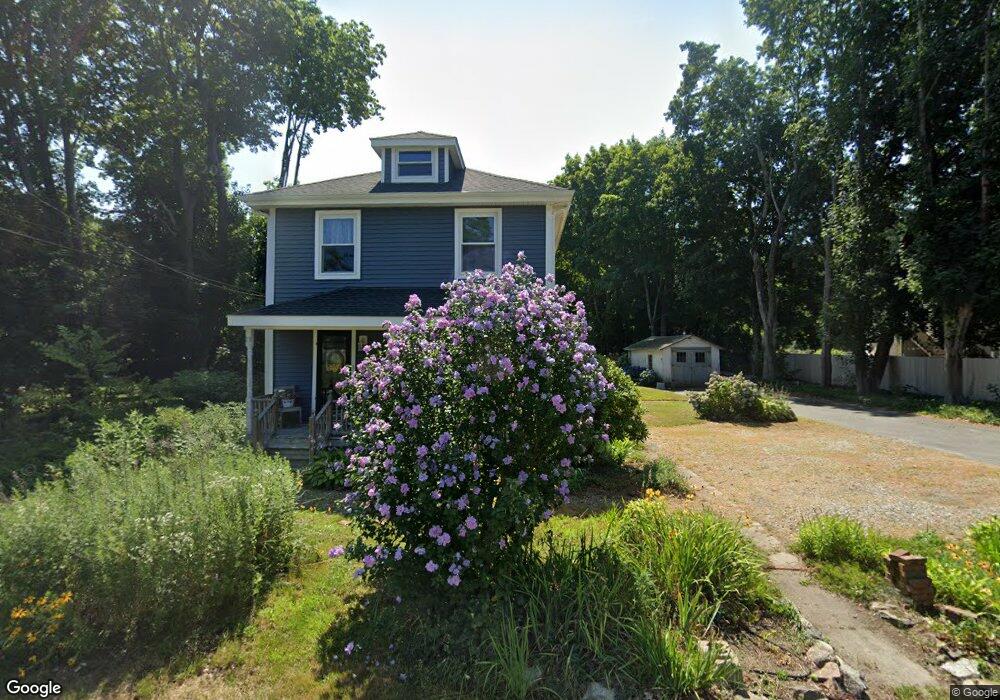
13 Wenham Rd Carver, MA 02330
Estimated Value: $428,000 - $539,000
3
Beds
2
Baths
1,603
Sq Ft
$313/Sq Ft
Est. Value
About This Home
This home is located at 13 Wenham Rd, Carver, MA 02330 and is currently estimated at $502,036, approximately $313 per square foot. 13 Wenham Rd is a home located in Plymouth County with nearby schools including Carver Elementary School, Carver Middle/High School, and Map Academy Charter School.
Create a Home Valuation Report for This Property
The Home Valuation Report is an in-depth analysis detailing your home's value as well as a comparison with similar homes in the area
Home Values in the Area
Average Home Value in this Area
Tax History
| Year | Tax Paid | Tax Assessment Tax Assessment Total Assessment is a certain percentage of the fair market value that is determined by local assessors to be the total taxable value of land and additions on the property. | Land | Improvement |
|---|---|---|---|---|
| 2025 | $5,799 | $418,100 | $130,400 | $287,700 |
| 2024 | $5,487 | $387,200 | $127,900 | $259,300 |
| 2023 | $5,023 | $344,300 | $127,900 | $216,400 |
| 2022 | $4,740 | $296,600 | $109,300 | $187,300 |
| 2021 | $4,525 | $267,100 | $97,600 | $169,500 |
| 2020 | $607 | $250,800 | $91,200 | $159,600 |
| 2019 | $12,732 | $244,100 | $88,600 | $155,500 |
| 2018 | $5,586 | $229,200 | $88,600 | $140,600 |
| 2017 | $5,594 | $214,500 | $80,700 | $133,800 |
| 2016 | $3,491 | $205,000 | $76,900 | $128,100 |
| 2015 | $3,402 | $200,000 | $76,900 | $123,100 |
| 2014 | $3,499 | $205,700 | $102,600 | $103,100 |
Source: Public Records
Map
Nearby Homes
- 89 Silva St
- 81 Center St
- 35 Silva St
- 13 Pond View Way
- 56 Bunnys Rd
- 6 Twin Pines Ln Unit 6
- 11 Brockton Ave
- 43 S Meadow Rd
- 67 Crystal Lake Dr
- 6 Susan Cir
- 235 Main St
- 7 Cedar Dr
- 48 S Meadow Village
- 29 S Meadow Village
- 55 S Meadow Village
- 1 Pinehurst Dr
- 26 Santana Way Unit 26
- 6 Coachman Terrace
- 0 Spring St
- 241 Carver Rd Unit 7
Your Personal Tour Guide
Ask me questions while you tour the home.