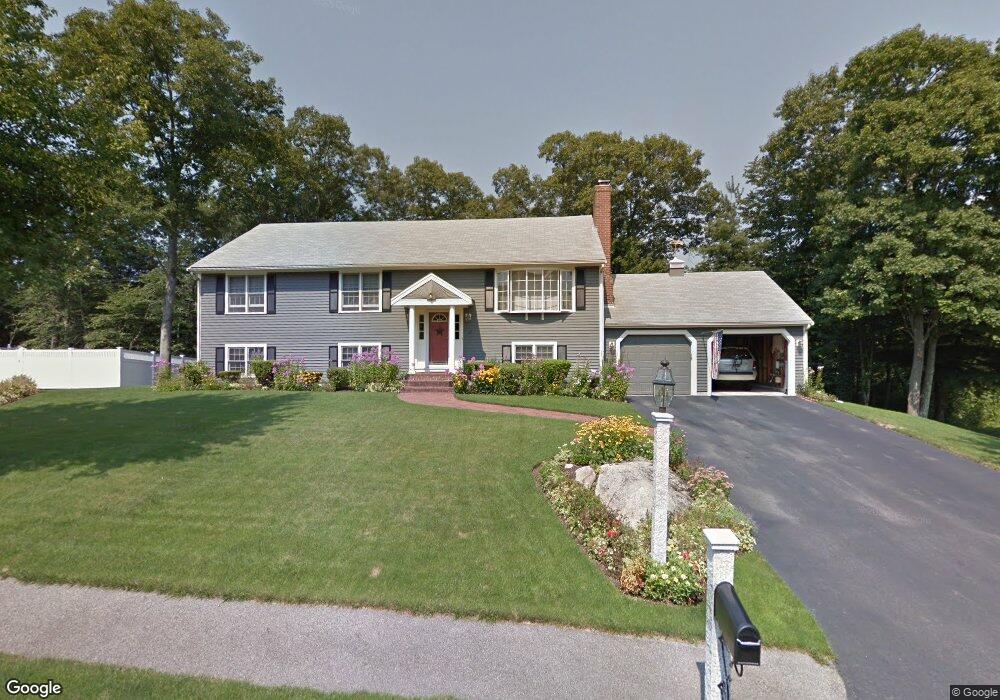
13 Weyfair Path South Weymouth, MA 02190
South Weymouth NeighborhoodEstimated Value: $785,600 - $938,000
3
Beds
3
Baths
1,400
Sq Ft
$630/Sq Ft
Est. Value
About This Home
This home is located at 13 Weyfair Path, South Weymouth, MA 02190 and is currently estimated at $881,400, approximately $629 per square foot. 13 Weyfair Path is a home located in Norfolk County with nearby schools including Ralph Talbot Primary School, Abigail Adams Middle School, and Weymouth Middle School Chapman.
Ownership History
Date
Name
Owned For
Owner Type
Purchase Details
Closed on
Jan 18, 2018
Sold by
Moore William C and Moore Marilou J
Bought by
Coveney Drew V and Coveney Maria C
Current Estimated Value
Home Financials for this Owner
Home Financials are based on the most recent Mortgage that was taken out on this home.
Original Mortgage
$500,000
Interest Rate
3.94%
Mortgage Type
New Conventional
Purchase Details
Closed on
May 23, 1994
Sold by
Ryder Dev Corp
Bought by
Moore William C and Moore Marilou J
Home Financials for this Owner
Home Financials are based on the most recent Mortgage that was taken out on this home.
Original Mortgage
$140,000
Interest Rate
8.44%
Mortgage Type
Purchase Money Mortgage
Create a Home Valuation Report for This Property
The Home Valuation Report is an in-depth analysis detailing your home's value as well as a comparison with similar homes in the area
Home Values in the Area
Average Home Value in this Area
Purchase History
| Date | Buyer | Sale Price | Title Company |
|---|---|---|---|
| Coveney Drew V | $575,000 | -- | |
| Moore William C | $218,500 | -- | |
| Moore William C | $218,500 | -- |
Source: Public Records
Mortgage History
| Date | Status | Borrower | Loan Amount |
|---|---|---|---|
| Previous Owner | Coveney Drew V | $500,000 | |
| Previous Owner | Moore William C | $140,000 |
Source: Public Records
Tax History Compared to Growth
Tax History
| Year | Tax Paid | Tax Assessment Tax Assessment Total Assessment is a certain percentage of the fair market value that is determined by local assessors to be the total taxable value of land and additions on the property. | Land | Improvement |
|---|---|---|---|---|
| 2025 | $7,701 | $762,500 | $244,600 | $517,900 |
| 2024 | $7,442 | $724,600 | $233,000 | $491,600 |
| 2023 | $7,446 | $712,500 | $235,300 | $477,200 |
| 2022 | $7,221 | $630,100 | $217,900 | $412,200 |
| 2021 | $6,760 | $575,800 | $217,900 | $357,900 |
| 2020 | $6,568 | $551,000 | $217,900 | $333,100 |
| 2019 | $6,504 | $536,600 | $209,500 | $327,100 |
| 2018 | $6,285 | $502,800 | $199,500 | $303,300 |
| 2017 | $6,186 | $482,900 | $190,100 | $292,800 |
| 2016 | $5,990 | $468,000 | $182,800 | $285,200 |
| 2015 | $5,708 | $442,500 | $182,800 | $259,700 |
| 2014 | $5,505 | $413,900 | $170,100 | $243,800 |
Source: Public Records
Map
Nearby Homes
- 376 Pleasant St
- 261 Pleasant St Unit 3
- 261 Pleasant St Unit 5
- 110 Burkhall St Unit H
- 120 Burkhall St Unit K
- 341 Ralph Talbot St
- 279 Pine St
- 200 Burkhall St Unit 102
- 191 Tall Oaks Dr Unit C
- 27 Park Ave
- 15 Ranger Cir
- 2 Mitchell Ln Unit B
- 20 Wilbur St
- 675 Pleasant St Unit 8
- 18 Fountain Ln Unit 2
- 60 Greentree Ln Unit 38
- 2 Tara Dr Unit 1
- 17 Berean Way
- 79 Tilden Rd
- 25 Echo Ave