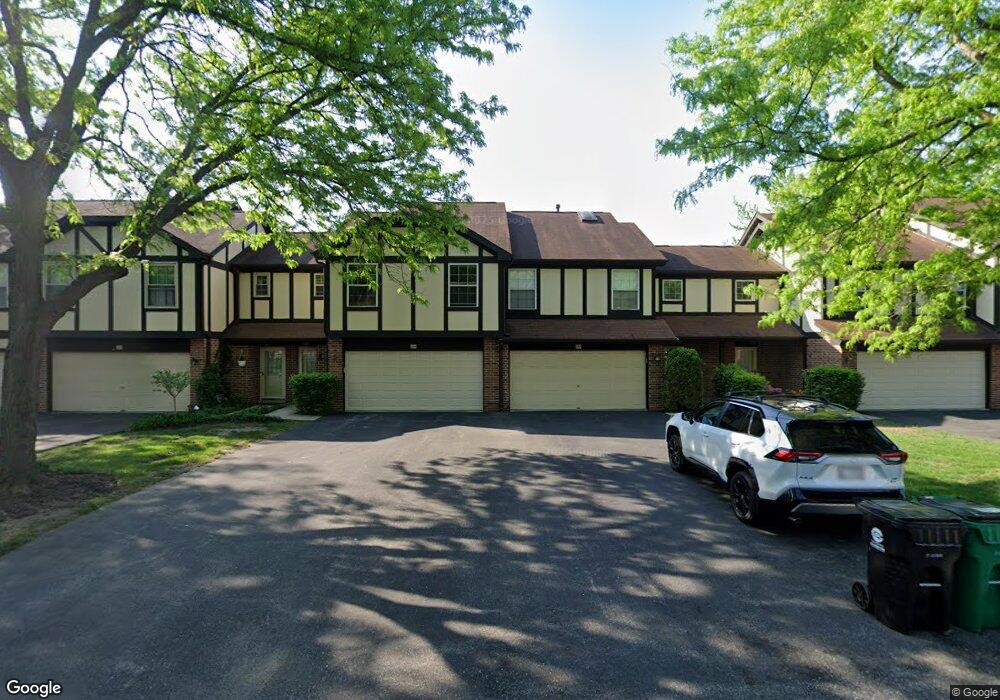
13 Willow Bridge Way Unit 2 Bloomingdale, IL 60108
Estimated Value: $295,000 - $352,000
2
Beds
3
Baths
1,301
Sq Ft
$249/Sq Ft
Est. Value
About This Home
This home is located at 13 Willow Bridge Way Unit 2, Bloomingdale, IL 60108 and is currently estimated at $323,726, approximately $248 per square foot. 13 Willow Bridge Way Unit 2 is a home located in DuPage County with nearby schools including Marquardt Middle School, Glenbard East High School, and St Matthew School.
Ownership History
Date
Name
Owned For
Owner Type
Purchase Details
Closed on
Feb 26, 2024
Sold by
Tuzzolino Josephine J
Bought by
Josephine J Tuzzolino Trust and Tuzzolino
Current Estimated Value
Purchase Details
Closed on
Jun 14, 1999
Sold by
Rossi Robert S
Bought by
Tuzzolino Josephine J
Home Financials for this Owner
Home Financials are based on the most recent Mortgage that was taken out on this home.
Original Mortgage
$123,200
Interest Rate
7.06%
Purchase Details
Closed on
Nov 30, 1993
Sold by
Lasalle National Trust
Bought by
Rossi Robert S
Home Financials for this Owner
Home Financials are based on the most recent Mortgage that was taken out on this home.
Original Mortgage
$105,000
Interest Rate
7.15%
Create a Home Valuation Report for This Property
The Home Valuation Report is an in-depth analysis detailing your home's value as well as a comparison with similar homes in the area
Home Values in the Area
Average Home Value in this Area
Purchase History
| Date | Buyer | Sale Price | Title Company |
|---|---|---|---|
| Josephine J Tuzzolino Trust | -- | None Listed On Document | |
| Tuzzolino Josephine J | $154,000 | First American Title Ins | |
| Rossi Robert S | $130,000 | Intercounty Title Company |
Source: Public Records
Mortgage History
| Date | Status | Borrower | Loan Amount |
|---|---|---|---|
| Previous Owner | Tuzzolino Josephine J | $123,200 | |
| Previous Owner | Rossi Robert S | $105,000 |
Source: Public Records
Tax History Compared to Growth
Tax History
| Year | Tax Paid | Tax Assessment Tax Assessment Total Assessment is a certain percentage of the fair market value that is determined by local assessors to be the total taxable value of land and additions on the property. | Land | Improvement |
|---|---|---|---|---|
| 2024 | $6,697 | $82,603 | $18,086 | $64,517 |
| 2023 | $6,089 | $75,730 | $16,540 | $59,190 |
| 2022 | $6,004 | $69,820 | $16,430 | $53,390 |
| 2021 | $5,873 | $66,340 | $15,610 | $50,730 |
| 2020 | $5,543 | $64,720 | $15,230 | $49,490 |
| 2019 | $5,578 | $63,270 | $15,410 | $47,860 |
| 2018 | $5,822 | $61,620 | $15,010 | $46,610 |
| 2017 | $5,508 | $57,110 | $13,910 | $43,200 |
| 2016 | $5,210 | $52,850 | $12,870 | $39,980 |
| 2015 | $5,088 | $49,320 | $12,010 | $37,310 |
| 2014 | $4,974 | $47,950 | $11,680 | $36,270 |
| 2013 | $5,037 | $49,590 | $12,080 | $37,510 |
Source: Public Records
Map
Nearby Homes
- 316 Juliana Ln
- 358 Mayo Ln
- 310 Terry Ln
- 316 Morningside Dr Unit A
- 300 Starling Ct Unit A
- 213 Dartmouth Ct Unit D
- 205 Emerson Ct Unit B
- 158 S Prairie Ave
- 319 Indiana Ct Unit D
- 881 N Swift Rd Unit 106
- 865 N Tamarac Blvd
- 802 N Tamarac Blvd Unit Z5
- 259 Cunningham Ln
- 2155 College Dr Unit 7
- 2158 College Dr Unit 7
- 120 Lakeview Dr Unit 513
- 120 Lakeview Dr Unit 318
- 264 Winston Ln
- 123 Fairlane Ct Unit C
- 953 N Rohlwing Rd Unit GB
- 13 Willow Bridge Way Unit 3
- 13 Willow Bridge Way Unit 4
- 13 Willow Bridge Way Unit 5
- 13 Willow Bridge Way Unit 1
- 13 Willow Bridge Way Unit 6
- 331 Country Ridge Ln
- 333 Country Ridge Ln
- 6 Willow Bridge Way Unit 3
- 6 Willow Bridge Way Unit 6
- 335 Country Ridge Ln Unit 2
- 337 Country Ridge Ln
- 315 Carriage Way
- 5 Willow Bridge Way
- 15 Willow Bridge Way Unit A
- 15 Willow Bridge Way Unit C
- 15 Willow Bridge Way Unit D
- 15 Willow Bridge Way Unit B
- 4 Willow Bridge Way Unit 41
- 339 Country Ridge Ln
- 310 Carriage Way Unit 2C