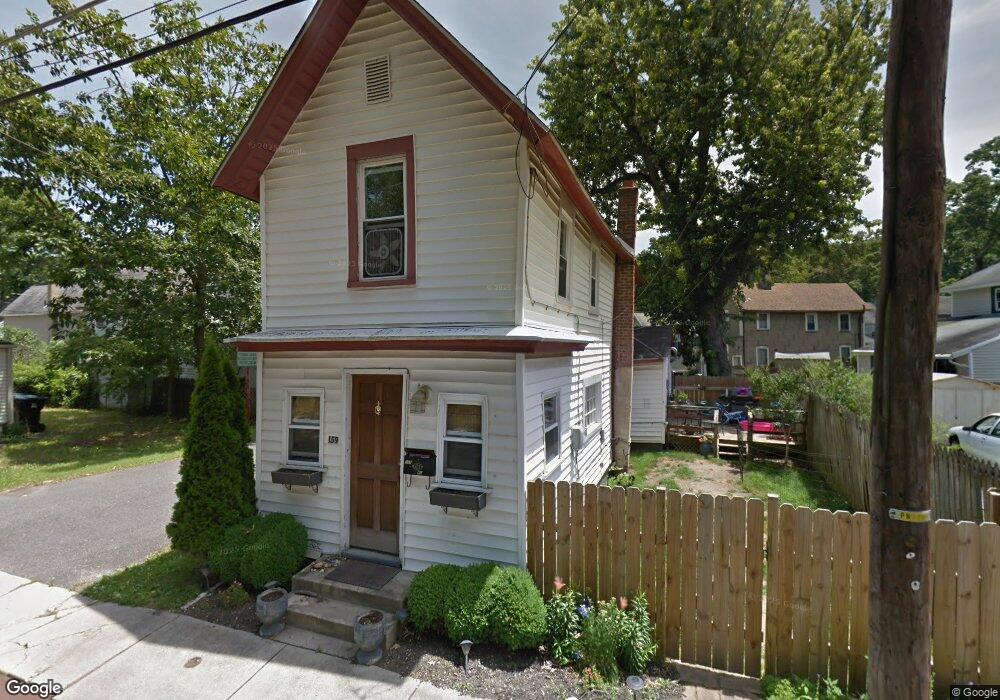
130 4th Ave Pitman, NJ 08071
Estimated Value: $204,752 - $237,000
Studio
--
Bath
816
Sq Ft
$272/Sq Ft
Est. Value
About This Home
This home is located at 130 4th Ave, Pitman, NJ 08071 and is currently estimated at $221,688, approximately $271 per square foot. 130 4th Ave is a home located in Gloucester County with nearby schools including W.C.K. Walls Elementary School, Pitman Middle School, and Pitman High School.
Ownership History
Date
Name
Owned For
Owner Type
Purchase Details
Closed on
Nov 15, 2000
Sold by
Mollenhauer Erik A and Mollenhauer Kristina C
Bought by
Devries Cindi E
Current Estimated Value
Home Financials for this Owner
Home Financials are based on the most recent Mortgage that was taken out on this home.
Original Mortgage
$44,200
Interest Rate
8%
Mortgage Type
Seller Take Back
Purchase Details
Closed on
May 15, 1996
Sold by
Mollenhauer Erik
Bought by
Mollenhauer Erik
Create a Home Valuation Report for This Property
The Home Valuation Report is an in-depth analysis detailing your home's value as well as a comparison with similar homes in the area
Home Values in the Area
Average Home Value in this Area
Purchase History
We collect this data history from publicly available records. To have your information removed, we recommend requesting removal directly through your county’s website.
| Date | Buyer | Sale Price | Title Company |
|---|---|---|---|
| Devries Cindi E | $50,000 | -- | |
| Mollenhauer Erik | -- | -- | |
| Mollenhauer Erik | -- | -- |
Source: Public Records
Mortgage History
We collect this data history from publicly available records. To have your information removed, we recommend requesting removal directly through your county’s website.
| Date | Status | Borrower | Loan Amount |
|---|---|---|---|
| Closed | Devries Cindi E | $44,200 |
Source: Public Records
Tax History
| Year | Tax Paid | Tax Assessment Tax Assessment Total Assessment is a certain percentage of the fair market value that is determined by local assessors to be the total taxable value of land and additions on the property. | Land | Improvement |
|---|---|---|---|---|
| 2025 | $4,499 | $128,800 | $23,600 | $105,200 |
| 2024 | $4,380 | $128,800 | $23,600 | $105,200 |
| 2023 | $4,380 | $128,800 | $23,600 | $105,200 |
| 2022 | $4,208 | $128,800 | $23,600 | $105,200 |
| 2021 | $2,682 | $73,200 | $19,400 | $53,800 |
| 2020 | $3,243 | $73,200 | $19,400 | $53,800 |
| 2019 | $3,167 | $73,200 | $19,400 | $53,800 |
| 2018 | $3,113 | $73,200 | $19,400 | $53,800 |
| 2017 | $3,074 | $73,200 | $19,400 | $53,800 |
| 2016 | $3,015 | $73,200 | $19,400 | $53,800 |
| 2015 | $2,934 | $73,200 | $19,400 | $53,800 |
| 2014 | $2,844 | $73,200 | $19,400 | $53,800 |
Source: Public Records
Map
Nearby Homes
- 105 3rd Ave
- 125 12th Ave
- 116 West Ave
- 26 East Ave
- 189 East Ave
- 198 West Ave
- 318 Boulevard Ave
- 214 W Holly Ave
- 328 Legion Ct
- 402 Wesley Ave
- 409 Wesley Ave
- 39 Elm Ave
- 349 W Jersey Ave
- 119 121 Grandview Ave
- 42 Evergreen Ave
- 407 Tuohy Ave
- 302 Montgomery Ave
- 20 E Woodland Ave
- 49 Wildwood Ave
- 502 Lakeview Ave
Your Personal Tour Guide
Ask me questions while you tour the home.