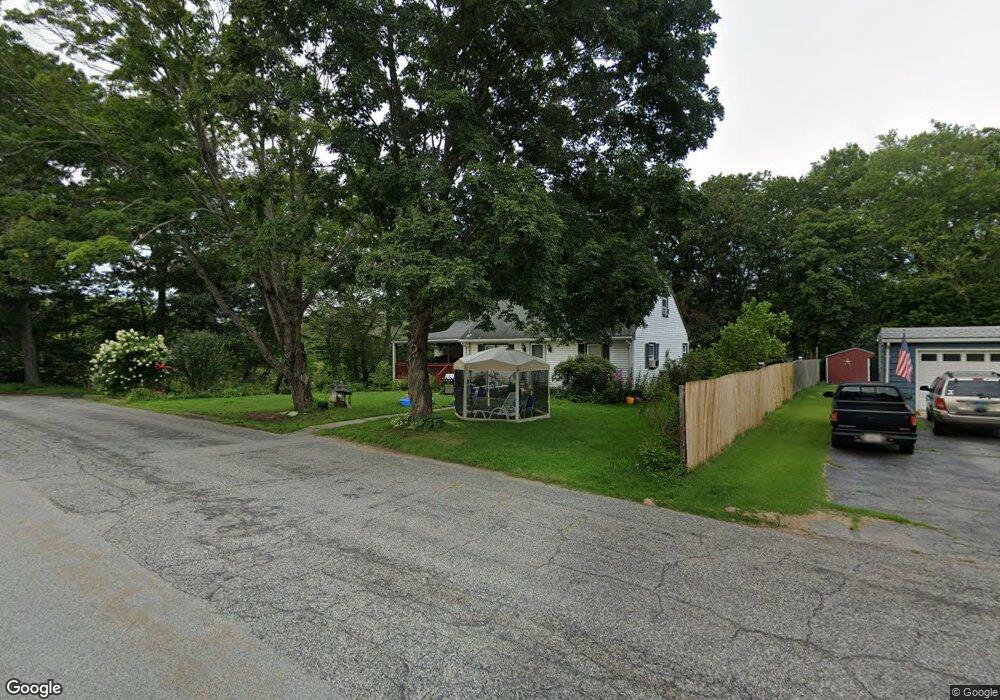
130 Adelaide St Danielson, CT 06239
Estimated Value: $313,000 - $321,000
3
Beds
1
Bath
1,120
Sq Ft
$282/Sq Ft
Est. Value
About This Home
This home is located at 130 Adelaide St, Danielson, CT 06239 and is currently estimated at $316,248, approximately $282 per square foot. 130 Adelaide St is a home located in Windham County with nearby schools including Killingly Central School, Killingly Memorial School, and Killingly Intermediate School.
Ownership History
Date
Name
Owned For
Owner Type
Purchase Details
Closed on
May 2, 2019
Sold by
Lafleche Randy J and Lafleche Pamela L
Bought by
Smith Ashley R
Current Estimated Value
Home Financials for this Owner
Home Financials are based on the most recent Mortgage that was taken out on this home.
Original Mortgage
$162,011
Outstanding Balance
$141,615
Interest Rate
4.12%
Mortgage Type
FHA
Estimated Equity
$174,633
Purchase Details
Closed on
May 21, 2014
Sold by
Putnam Angela and Putnam Stanley R
Bought by
Lafleche Randy J and Lafleche Pamela
Home Financials for this Owner
Home Financials are based on the most recent Mortgage that was taken out on this home.
Original Mortgage
$162,500
Interest Rate
4.33%
Mortgage Type
New Conventional
Purchase Details
Closed on
Jan 23, 2001
Sold by
Dauphinais Robert and Dauphinais Theresa
Bought by
Putnam Stanley R and Putnam Angela
Create a Home Valuation Report for This Property
The Home Valuation Report is an in-depth analysis detailing your home's value as well as a comparison with similar homes in the area
Home Values in the Area
Average Home Value in this Area
Purchase History
| Date | Buyer | Sale Price | Title Company |
|---|---|---|---|
| Smith Ashley R | $165,000 | -- | |
| Smith Ashley R | $165,000 | -- | |
| Lafleche Randy J | $162,500 | -- | |
| Lafleche Randy J | $162,500 | -- | |
| Putnam Stanley R | $105,000 | -- | |
| Putnam Stanley R | $105,000 | -- |
Source: Public Records
Mortgage History
| Date | Status | Borrower | Loan Amount |
|---|---|---|---|
| Open | Smith Ashley R | $162,011 | |
| Closed | Smith Ashley R | $162,011 | |
| Previous Owner | Putnam Stanley R | $162,500 |
Source: Public Records
Tax History
| Year | Tax Paid | Tax Assessment Tax Assessment Total Assessment is a certain percentage of the fair market value that is determined by local assessors to be the total taxable value of land and additions on the property. | Land | Improvement |
|---|---|---|---|---|
| 2025 | $3,800 | $151,690 | $29,120 | $122,570 |
| 2024 | $3,627 | $151,690 | $29,120 | $122,570 |
| 2023 | $3,421 | $106,610 | $24,150 | $82,460 |
| 2022 | $3,219 | $106,610 | $24,150 | $82,460 |
| 2021 | $3,219 | $106,610 | $24,150 | $82,460 |
| 2020 | $3,165 | $106,610 | $24,150 | $82,460 |
| 2019 | $3,199 | $106,610 | $24,150 | $82,460 |
| 2017 | $2,570 | $79,660 | $15,400 | $64,260 |
| 2016 | $2,570 | $79,660 | $15,400 | $64,260 |
| 2015 | $2,518 | $79,660 | $15,400 | $64,260 |
| 2014 | $2,458 | $79,660 | $15,400 | $64,260 |
Source: Public Records
Map
Nearby Homes
- 135 Adelaide St
- 37 Ruth St
- 133 Maple St
- 37 Katherine Ave
- 144 Prospect Ave
- 35 S Main St
- 0 Providence Rd Unit 24080985
- 19 Plaza St
- 53 S Main St
- 10 Center St
- 85 Furnace St
- 24 Center St
- 102 Cottage St
- 74 Athol St
- 10 Cote Dr
- 48 Athol St Unit 48
- 150 Broad St
- 0 Allen Hill Rd Unit 24140370
- 7 Lockwood St
- 73 Hawkins St
Your Personal Tour Guide
Ask me questions while you tour the home.