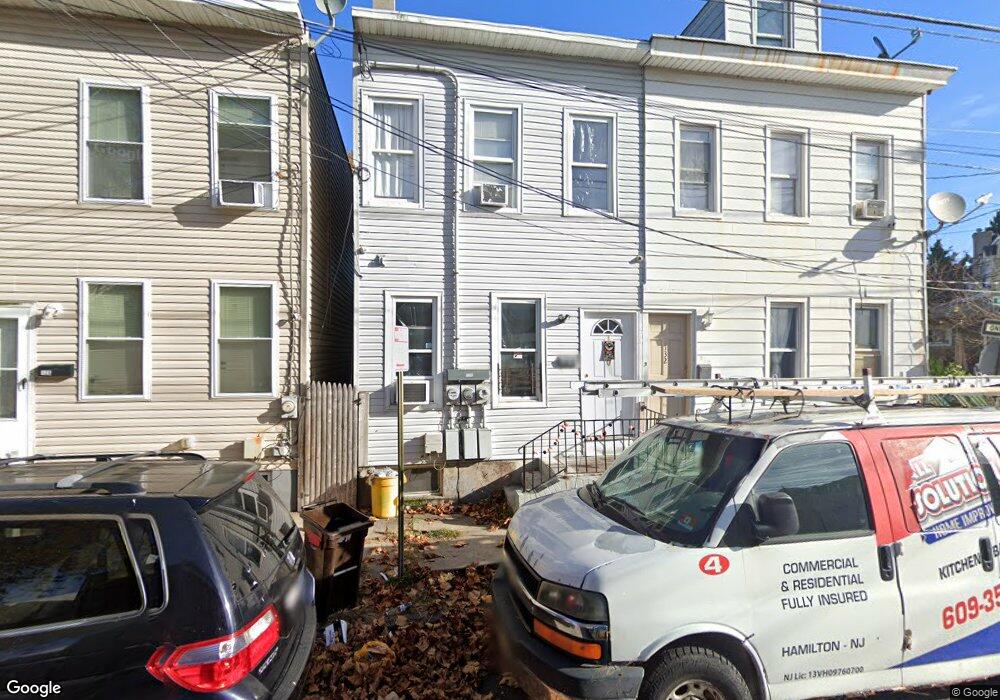
130 Adeline St Trenton, NJ 08611
Chambersburg NeighborhoodEstimated Value: $189,000 - $232,000
--
Bed
--
Bath
1,104
Sq Ft
$190/Sq Ft
Est. Value
About This Home
This home is located at 130 Adeline St, Trenton, NJ 08611 and is currently estimated at $209,587, approximately $189 per square foot. 130 Adeline St is a home located in Mercer County with nearby schools including Parker Elementary School, Robbins Elementary School, and Dr. Crosby Copeland Elementary School.
Ownership History
Date
Name
Owned For
Owner Type
Purchase Details
Closed on
Dec 1, 2014
Sold by
Stern Moses
Bought by
442 Walnut Llc
Current Estimated Value
Purchase Details
Closed on
Sep 25, 2014
Sold by
Ali Arifah and Atlantic County Bd Social Services
Bought by
Mercer S M E Inc
Home Financials for this Owner
Home Financials are based on the most recent Mortgage that was taken out on this home.
Interest Rate
4.2%
Purchase Details
Closed on
Aug 5, 2014
Sold by
Mercer Sme Inc
Bought by
Stern Moses
Home Financials for this Owner
Home Financials are based on the most recent Mortgage that was taken out on this home.
Interest Rate
4.2%
Purchase Details
Closed on
Apr 15, 2009
Sold by
Espinal Rosero Eudocia
Bought by
Espinal Rosero Eudocia and Ali Hassan S
Purchase Details
Closed on
Jul 9, 2008
Sold by
Rosero Edgar M
Bought by
Rosero Eudocia E
Purchase Details
Closed on
Mar 13, 2002
Sold by
Spirala Zbignieww
Bought by
Rosero Edgar
Create a Home Valuation Report for This Property
The Home Valuation Report is an in-depth analysis detailing your home's value as well as a comparison with similar homes in the area
Home Values in the Area
Average Home Value in this Area
Purchase History
| Date | Buyer | Sale Price | Title Company |
|---|---|---|---|
| 442 Walnut Llc | $40,000 | Riverside Abstract Nj | |
| Mercer S M E Inc | $100 | -- | |
| Stern Moses | $24,000 | -- | |
| Espinal Rosero Eudocia | -- | Fidelity National Title Insu | |
| Rosero Eudocia E | -- | -- | |
| Rosero Edgar | $3,500 | -- |
Source: Public Records
Mortgage History
| Date | Status | Borrower | Loan Amount |
|---|---|---|---|
| Previous Owner | Mercer S M E Inc | -- |
Source: Public Records
Tax History Compared to Growth
Tax History
| Year | Tax Paid | Tax Assessment Tax Assessment Total Assessment is a certain percentage of the fair market value that is determined by local assessors to be the total taxable value of land and additions on the property. | Land | Improvement |
|---|---|---|---|---|
| 2025 | $3,214 | $55,400 | $8,300 | $47,100 |
| 2024 | $3,084 | $55,400 | $8,300 | $47,100 |
| 2023 | $3,084 | $55,400 | $8,300 | $47,100 |
| 2022 | $3,024 | $55,400 | $8,300 | $47,100 |
| 2021 | $3,076 | $55,400 | $8,300 | $47,100 |
| 2020 | $3,066 | $55,400 | $8,300 | $47,100 |
| 2019 | $3,017 | $55,400 | $8,300 | $47,100 |
| 2018 | $2,888 | $55,400 | $8,300 | $47,100 |
| 2017 | $2,745 | $55,400 | $8,300 | $47,100 |
| 2016 | $3,843 | $66,800 | $15,000 | $51,800 |
| 2015 | $5,492 | $95,800 | $15,000 | $80,800 |
| 2014 | $5,466 | $95,800 | $15,000 | $80,800 |
Source: Public Records
Map
Nearby Homes
- 106 Home Ave
- 826 S Clinton Ave
- 617 Beatty St
- 978 S Broad St
- 984 S Broad St
- 464 Genesee St
- 1081 S Clinton Ave
- 11 Cummings Ave
- 989 S Broad St
- 1611 Chestnut Ave
- 211 Elm St
- 113 Hewitt St
- 131 Hewitt St
- 104 Randall Ave
- 407 Hudson St
- 724 Division St
- 106 Woodland St
- 836 Beatty St
- 104 Barnt Ave
- 315 Hudson St