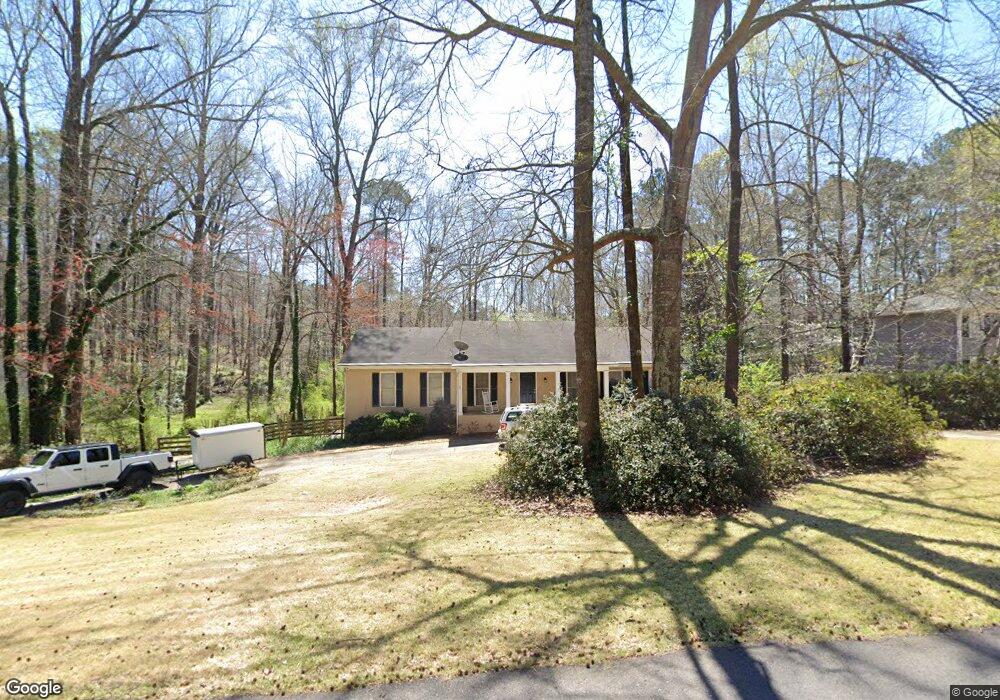
130 Ashling Dr Lagrange, GA 30240
Estimated Value: $356,000 - $376,000
3
Beds
3
Baths
3,570
Sq Ft
$103/Sq Ft
Est. Value
About This Home
This home is located at 130 Ashling Dr, Lagrange, GA 30240 and is currently estimated at $366,216, approximately $102 per square foot. 130 Ashling Dr is a home located in Troup County with nearby schools including Franklin Forest Elementary School, Hollis Hand Elementary School, and Ethel W. Kight Elementary School.
Ownership History
Date
Name
Owned For
Owner Type
Purchase Details
Closed on
Apr 23, 2019
Sold by
Johnson David Andrew
Bought by
Magouirk Michael Shane and Magouirk Tracy L
Current Estimated Value
Home Financials for this Owner
Home Financials are based on the most recent Mortgage that was taken out on this home.
Original Mortgage
$225,342
Outstanding Balance
$196,688
Interest Rate
4.25%
Mortgage Type
FHA
Estimated Equity
$169,528
Purchase Details
Closed on
May 30, 2000
Sold by
Cheryl Ellison C and Cheryl Rudd
Bought by
Johnson David Andrew
Purchase Details
Closed on
Jul 2, 1991
Sold by
Susan Harold and Susan Kalich
Bought by
Cheryl Ellison C and Cheryl Rudd
Purchase Details
Closed on
Nov 14, 1988
Sold by
Germaine John and Germaine Rose
Bought by
Susan Harold and Susan Kalich
Purchase Details
Closed on
Jul 2, 1984
Sold by
Dan Ric and Est Ga Est
Bought by
Germaine John and Germaine Rose
Purchase Details
Closed on
Mar 22, 1984
Bought by
Dan Ric and Est Ga Est
Purchase Details
Closed on
Jun 29, 1981
Create a Home Valuation Report for This Property
The Home Valuation Report is an in-depth analysis detailing your home's value as well as a comparison with similar homes in the area
Purchase History
| Date | Buyer | Sale Price | Title Company |
|---|---|---|---|
| Magouirk Michael Shane | $229,500 | -- | |
| Johnson David Andrew | $166,900 | -- | |
| Cheryl Ellison C | $111,000 | -- | |
| Susan Harold | $113,800 | -- | |
| Germaine John | -- | -- | |
| Dan Ric | -- | -- | |
| -- | -- | -- |
Source: Public Records
Mortgage History
| Date | Status | Borrower | Loan Amount |
|---|---|---|---|
| Open | Magouirk Michael Shane | $225,342 |
Source: Public Records
Tax History
| Year | Tax Paid | Tax Assessment Tax Assessment Total Assessment is a certain percentage of the fair market value that is determined by local assessors to be the total taxable value of land and additions on the property. | Land | Improvement |
|---|---|---|---|---|
| 2025 | $3,636 | $133,332 | $18,000 | $115,332 |
| 2024 | $3,167 | $116,112 | $18,000 | $98,112 |
| 2023 | $3,007 | $110,240 | $14,000 | $96,240 |
| 2022 | $2,879 | $103,160 | $14,000 | $89,160 |
| 2021 | $2,702 | $89,600 | $14,000 | $75,600 |
| 2020 | $2,702 | $89,600 | $14,000 | $75,600 |
| 2019 | $1,879 | $64,304 | $12,000 | $52,304 |
| 2018 | $1,815 | $62,184 | $10,160 | $52,024 |
| 2017 | $1,654 | $56,820 | $8,700 | $48,120 |
| 2016 | $1,656 | $56,882 | $8,700 | $48,182 |
| 2015 | $1,704 | $58,378 | $10,196 | $48,182 |
| 2014 | $1,630 | $55,842 | $10,196 | $45,646 |
| 2013 | -- | $54,223 | $10,092 | $44,131 |
Source: Public Records
Map
Nearby Homes
- 104 Englewood Dr
- 104 Sweetgum Dr
- 1784 Mooty Bridge Rd
- 114 Red Oak Trail
- 91 Richmond Dr
- 204 Dixie Creek Dr
- 102 Beech Creek Dr
- 502 Ashford Cir
- 103 Windridge
- 107 Windridge
- 209 River Oaks Dr
- 103 Woodchase
- 109 Windridge
- 201 S Chilton Crescent
- 203 S Chilton Crescent
- 110 Pond View Point
- 732 Camellia Dr
- 134 S Page St
- 724 Camellia Dr
- 106 Ewing St
- 128 Ashling Dr
- 132 Ashling Dr
- 126 Ashling Dr
- 129 Ashling Dr
- 125 St Anthony Dr
- 131 Ashling Dr
- 134 Ashling Dr
- 127 Saint Anthony Dr
- 127 Ashling Dr
- 133 Ashling Dr
- 123 St Anthony Dr
- 124 Ashling Dr
- 125 Ashling Dr
- 112 Kildare Ct
- 110 Kildare Ct
- 123 Ashling Dr
- 122 Ashling Dr
- 121 Saint Anthony Dr
- 108 Kildare Ct
- 129 Saint Anthony Ct Unit 15
Your Personal Tour Guide
Ask me questions while you tour the home.