130 Ashmore Dr Athens, GA 30601
Estimated Value: $221,000 - $237,000
--
Bed
2
Baths
1,848
Sq Ft
$123/Sq Ft
Est. Value
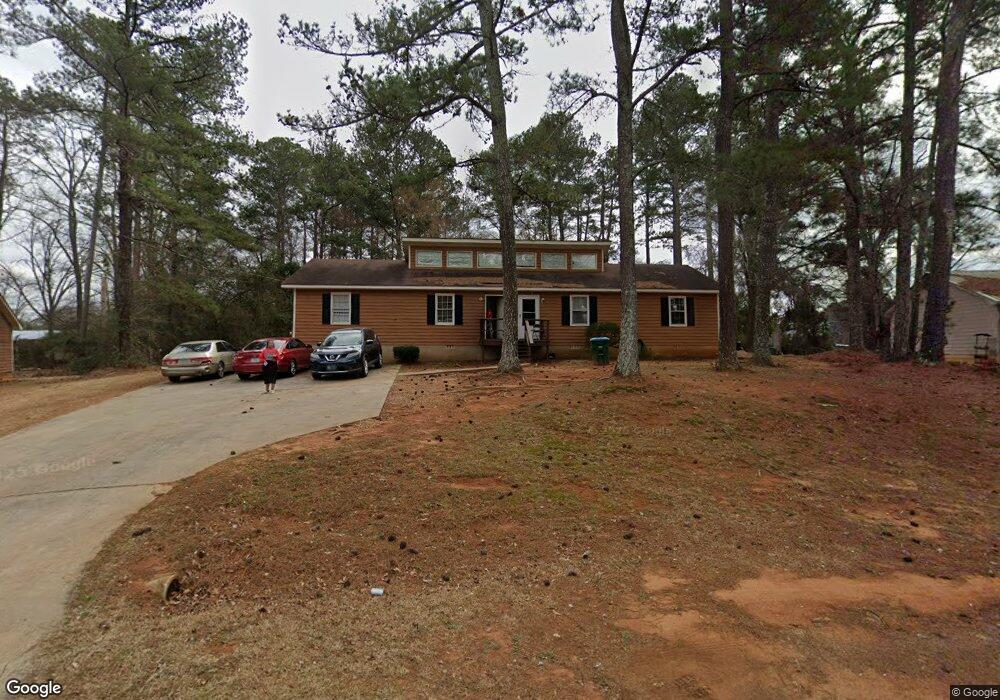
About This Home
This home is located at 130 Ashmore Dr, Athens, GA 30601 and is currently estimated at $227,307, approximately $123 per square foot. 130 Ashmore Dr is a home located in Clarke County with nearby schools including Fowler Drive Elementary School, Coile Middle School, and Cedar Shoals High School.
Ownership History
Date
Name
Owned For
Owner Type
Purchase Details
Closed on
Nov 22, 2024
Sold by
Joiner Henry D
Bought by
Francis Paul
Current Estimated Value
Home Financials for this Owner
Home Financials are based on the most recent Mortgage that was taken out on this home.
Original Mortgage
$163,875
Outstanding Balance
$162,213
Interest Rate
6.54%
Mortgage Type
New Conventional
Estimated Equity
$65,094
Purchase Details
Closed on
Feb 9, 2022
Sold by
Zhang & Xus Limited Partnership
Bought by
Joiner Henry D
Home Financials for this Owner
Home Financials are based on the most recent Mortgage that was taken out on this home.
Original Mortgage
$140,000
Interest Rate
3.55%
Mortgage Type
Mortgage Modification
Purchase Details
Closed on
Jun 29, 2007
Sold by
Not Provided
Bought by
Zhang
Purchase Details
Closed on
Nov 9, 1998
Sold by
Croker William T
Bought by
Zhang Pei
Create a Home Valuation Report for This Property
The Home Valuation Report is an in-depth analysis detailing your home's value as well as a comparison with similar homes in the area
Home Values in the Area
Average Home Value in this Area
Purchase History
| Date | Buyer | Sale Price | Title Company |
|---|---|---|---|
| Francis Paul | $218,500 | -- | |
| Joiner Henry D | $175,000 | -- | |
| Zhang | -- | -- | |
| Zhang Pei | $57,100 | -- |
Source: Public Records
Mortgage History
| Date | Status | Borrower | Loan Amount |
|---|---|---|---|
| Open | Francis Paul | $163,875 | |
| Previous Owner | Joiner Henry D | $140,000 |
Source: Public Records
Tax History Compared to Growth
Tax History
| Year | Tax Paid | Tax Assessment Tax Assessment Total Assessment is a certain percentage of the fair market value that is determined by local assessors to be the total taxable value of land and additions on the property. | Land | Improvement |
|---|---|---|---|---|
| 2025 | $3,175 | $102,245 | $12,000 | $90,245 |
| 2024 | $3,175 | $87,796 | $12,000 | $75,796 |
| 2023 | $2,744 | $71,462 | $10,400 | $61,062 |
| 2022 | $1,891 | $59,266 | $10,400 | $48,866 |
| 2021 | $1,278 | $37,925 | $8,000 | $29,925 |
| 2020 | $1,243 | $36,875 | $8,000 | $28,875 |
| 2019 | $1,157 | $34,081 | $8,000 | $26,081 |
| 2018 | $1,083 | $31,887 | $7,200 | $24,687 |
| 2017 | $812 | $23,906 | $7,200 | $16,706 |
| 2016 | $812 | $23,906 | $7,200 | $16,706 |
| 2015 | $814 | $23,949 | $7,200 | $16,749 |
| 2014 | $735 | $21,600 | $7,200 | $14,400 |
Source: Public Records
Map
Nearby Homes
- 155 Ashmore Dr
- 192 Sunny Hills Dr
- 495 Boley Dr
- 140 Loblolly Dr
- 0 Danielsville Rd Unit 8926755
- 0 Danielsville Rd Unit 979729
- 210 Hull Rd
- 136 Bridgewater Cir
- 156 Connally Cir
- 464 Ruth St
- 455 Ruth St
- 211 North Ave Unit 1333
- 239 Ruth St Unit 15
- 110 Connelly Cir
- 0 Old Commerce Rd Unit 10617666
- 118 Ruth Dr Unit 130
- 6006 Smokey
- 560 Rosa Nell Howard St
- 249 Fifth St
- 239 Madison Heights
- 130 Ashmore Dr Unit 132/130
- 130 Ashmore Dr Unit 2
- 124 Ashmore Dr
- 120 Ashmore Dr
- 114 Ashmore Dr
- 140 Ashmore Dr
- 135 Ashmore Dr
- 110 Ashmore Dr
- 150 Ashmore Dr
- 115 Ashmore Dr
- 157 Ashmore Dr
- 925 Danielsville Rd
- 406 Freeman Dr Unit 408
- 406 Freeman Dr
- 402 Freeman Dr Unit 402-404
- 165 Ashmore Dr
- 410 Freeman Dr
- 160 Ashmore Dr
- 414 Freeman Dr Unit 416