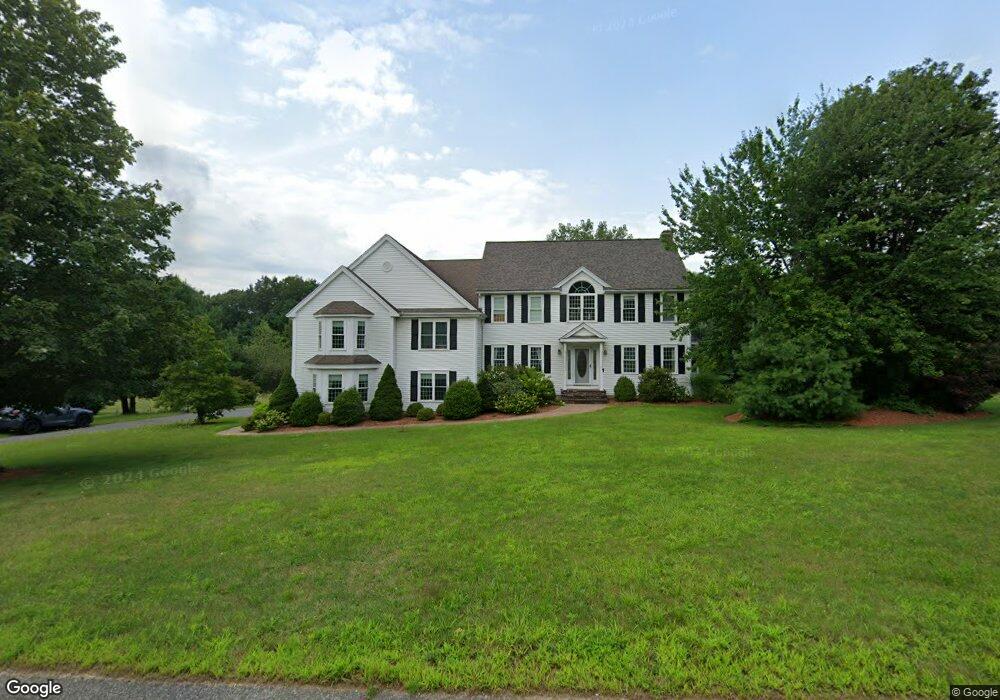
130 Autumn Rd Wrentham, MA 02093
West Wrentham NeighborhoodEstimated Value: $986,000 - $1,274,000
4
Beds
3
Baths
2,800
Sq Ft
$405/Sq Ft
Est. Value
About This Home
This home is located at 130 Autumn Rd, Wrentham, MA 02093 and is currently estimated at $1,133,826, approximately $404 per square foot. 130 Autumn Rd is a home located in Norfolk County with nearby schools including Delaney Elementary School, Charles E Roderick, and Mercymount Country Day School.
Ownership History
Date
Name
Owned For
Owner Type
Purchase Details
Closed on
Mar 6, 2017
Sold by
Dwinell John F and Gianetti Pamela J
Bought by
Pamela J Gianetti Ret
Current Estimated Value
Purchase Details
Closed on
Jan 15, 1997
Sold by
Meyer Daniel J and Meyer Sara G
Bought by
Dwinell John F
Purchase Details
Closed on
Apr 14, 1994
Sold by
Bailey & Zayhner Bldrs
Bought by
Meyer Daniel J and Meyer Sara G
Create a Home Valuation Report for This Property
The Home Valuation Report is an in-depth analysis detailing your home's value as well as a comparison with similar homes in the area
Home Values in the Area
Average Home Value in this Area
Purchase History
| Date | Buyer | Sale Price | Title Company |
|---|---|---|---|
| Pamela J Gianetti Ret | -- | -- | |
| Dwinell John F | $277,950 | -- | |
| Meyer Daniel J | $270,000 | -- |
Source: Public Records
Mortgage History
| Date | Status | Borrower | Loan Amount |
|---|---|---|---|
| Previous Owner | Meyer Daniel J | $291,500 | |
| Previous Owner | Meyer Daniel J | $295,000 | |
| Previous Owner | Meyer Daniel J | $300,000 |
Source: Public Records
Tax History Compared to Growth
Tax History
| Year | Tax Paid | Tax Assessment Tax Assessment Total Assessment is a certain percentage of the fair market value that is determined by local assessors to be the total taxable value of land and additions on the property. | Land | Improvement |
|---|---|---|---|---|
| 2025 | $10,356 | $893,500 | $289,700 | $603,800 |
| 2024 | $9,828 | $819,000 | $289,700 | $529,300 |
| 2023 | $10,005 | $792,800 | $263,600 | $529,200 |
| 2022 | $9,610 | $703,000 | $256,800 | $446,200 |
| 2021 | $9,155 | $650,700 | $240,100 | $410,600 |
| 2020 | $8,854 | $621,300 | $183,700 | $437,600 |
| 2019 | $8,495 | $601,600 | $183,700 | $417,900 |
| 2018 | $8,420 | $591,300 | $183,500 | $407,800 |
| 2017 | $8,184 | $574,300 | $180,000 | $394,300 |
| 2016 | $8,017 | $561,400 | $174,800 | $386,600 |
| 2015 | $8,043 | $536,900 | $168,000 | $368,900 |
| 2014 | $7,911 | $516,700 | $161,600 | $355,100 |
Source: Public Records
Map
Nearby Homes
- 60 Grant Ave
- 50 Wamsutta Way
- 50 Heather Ln
- 2095 West St
- 236 Williams St
- 39 Sumner Brown Rd
- 180 Pine Swamp Rd
- 56 Pine Swamp Rd
- 25 Nature View Dr
- 20 Nature View Dr
- 300 Tower Hill Rd
- 4022 Diamond Hill Rd
- 9 Pebble Cir Unit 9
- 219 Dawn Blvd
- 245 W Wrentham Rd
- 65 Palmetto Dr Unit 65
- 21 Palmetto Dr Unit 21
- 24 Palmetto Dr Unit 24
- 851 Washington St
- 2 Duhamel Way