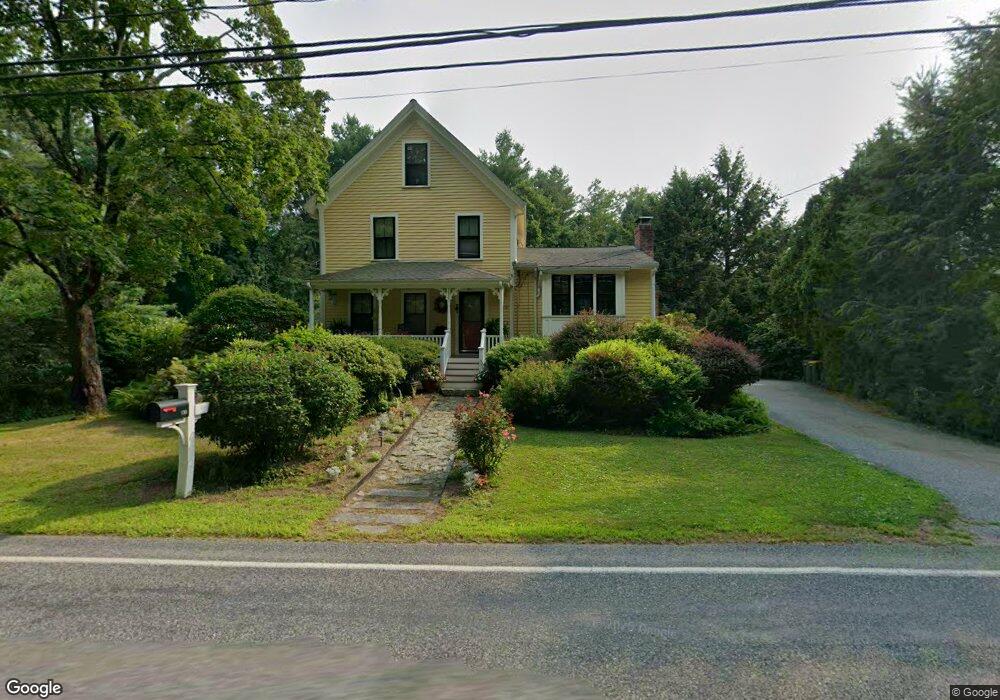
130 Balcom St Mansfield, MA 02048
Estimated Value: $596,000 - $750,000
3
Beds
1
Bath
1,600
Sq Ft
$405/Sq Ft
Est. Value
About This Home
This home is located at 130 Balcom St, Mansfield, MA 02048 and is currently estimated at $647,299, approximately $404 per square foot. 130 Balcom St is a home located in Bristol County with nearby schools including Everett W. Robinson Elementary School, Jordan/Jackson Elementary School, and Harold L. Qualters Middle School.
Ownership History
Date
Name
Owned For
Owner Type
Purchase Details
Closed on
Jan 30, 2015
Sold by
Orlando Barbara A
Bought by
Mavrides Michael G
Current Estimated Value
Purchase Details
Closed on
Apr 26, 1990
Sold by
Millette Geraldine A
Bought by
Jankowski Kevin R
Home Financials for this Owner
Home Financials are based on the most recent Mortgage that was taken out on this home.
Original Mortgage
$120,000
Interest Rate
10.26%
Mortgage Type
Purchase Money Mortgage
Create a Home Valuation Report for This Property
The Home Valuation Report is an in-depth analysis detailing your home's value as well as a comparison with similar homes in the area
Home Values in the Area
Average Home Value in this Area
Purchase History
| Date | Buyer | Sale Price | Title Company |
|---|---|---|---|
| Mavrides Michael G | $25,000 | -- | |
| Jankowski Kevin R | $136,000 | -- |
Source: Public Records
Mortgage History
| Date | Status | Borrower | Loan Amount |
|---|---|---|---|
| Previous Owner | Jankowski Kevin R | $119,396 | |
| Previous Owner | Jankowski Kevin R | $120,000 |
Source: Public Records
Tax History Compared to Growth
Tax History
| Year | Tax Paid | Tax Assessment Tax Assessment Total Assessment is a certain percentage of the fair market value that is determined by local assessors to be the total taxable value of land and additions on the property. | Land | Improvement |
|---|---|---|---|---|
| 2025 | $6,686 | $507,700 | $241,800 | $265,900 |
| 2024 | $6,742 | $499,400 | $241,800 | $257,600 |
| 2023 | $6,535 | $463,800 | $241,800 | $222,000 |
| 2022 | $6,458 | $425,700 | $223,800 | $201,900 |
| 2021 | $3,548 | $385,600 | $196,000 | $189,600 |
| 2020 | $5,396 | $351,300 | $186,600 | $164,700 |
| 2019 | $3,245 | $341,700 | $155,400 | $186,300 |
| 2018 | $3,612 | $326,200 | $148,200 | $178,000 |
| 2017 | $4,787 | $318,700 | $144,000 | $174,700 |
| 2016 | $4,523 | $293,500 | $137,100 | $156,400 |
| 2015 | $4,345 | $280,300 | $137,100 | $143,200 |
Source: Public Records
Map
Nearby Homes
- 4 Buckskin Dr
- 150 Gilbert St
- 176 Elm St
- 2 Oak St Unit 2D
- 2 Oak St Unit 2A
- 2 Oak St Unit 2C
- 2 Oak St Unit 2B
- 451R Gilbert St
- 255 Mckeon Dr
- 37 Oakleaf Dr
- 24 Maverick Dr
- 231 Spring St
- 196 Donald Tennant Cir
- 450 West St
- 250 Mansfield Ave Unit 66
- 14 Country Club Way
- 11 Landry Ave
- 115 Westfield Dr
- 11 Buckthorn Ln
- 15 Reservoir St Unit 44