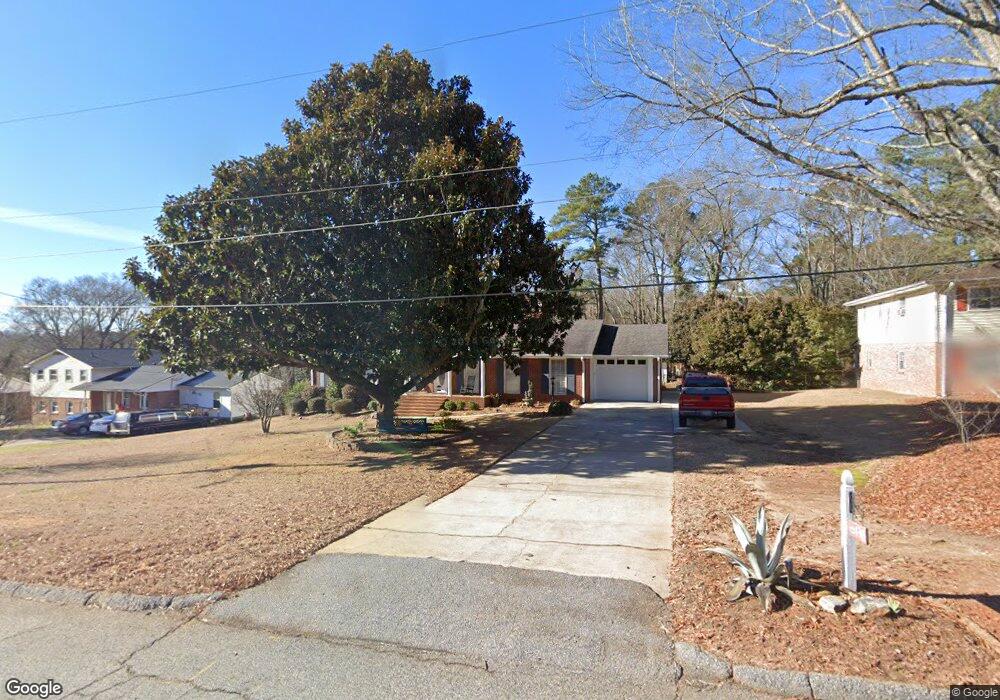
130 Bolton St Monroe, GA 30655
Estimated Value: $255,000 - $349,000
--
Bed
--
Bath
2,087
Sq Ft
$143/Sq Ft
Est. Value
About This Home
This home is located at 130 Bolton St, Monroe, GA 30655 and is currently estimated at $298,138, approximately $142 per square foot. 130 Bolton St is a home located in Walton County with nearby schools including Monroe Elementary School, Carver Middle School, and Monroe Area High School.
Ownership History
Date
Name
Owned For
Owner Type
Purchase Details
Closed on
Feb 25, 1999
Sold by
Evans Katherine L
Bought by
Brown James Rufus
Current Estimated Value
Home Financials for this Owner
Home Financials are based on the most recent Mortgage that was taken out on this home.
Original Mortgage
$75,000
Outstanding Balance
$18,214
Interest Rate
6.79%
Mortgage Type
New Conventional
Estimated Equity
$279,924
Purchase Details
Closed on
Aug 19, 1991
Bought by
Evans Katherine L
Create a Home Valuation Report for This Property
The Home Valuation Report is an in-depth analysis detailing your home's value as well as a comparison with similar homes in the area
Home Values in the Area
Average Home Value in this Area
Purchase History
| Date | Buyer | Sale Price | Title Company |
|---|---|---|---|
| Brown James Rufus | $108,000 | -- | |
| Evans Katherine L | $77,100 | -- |
Source: Public Records
Mortgage History
| Date | Status | Borrower | Loan Amount |
|---|---|---|---|
| Open | Brown James Rufus | $75,000 |
Source: Public Records
Tax History Compared to Growth
Tax History
| Year | Tax Paid | Tax Assessment Tax Assessment Total Assessment is a certain percentage of the fair market value that is determined by local assessors to be the total taxable value of land and additions on the property. | Land | Improvement |
|---|---|---|---|---|
| 2024 | $1,037 | $102,640 | $18,000 | $84,640 |
| 2023 | $997 | $99,600 | $14,000 | $85,600 |
| 2022 | $847 | $69,840 | $14,000 | $55,840 |
| 2021 | $763 | $55,200 | $10,800 | $44,400 |
| 2020 | $718 | $46,760 | $6,000 | $40,760 |
| 2019 | $725 | $43,360 | $6,000 | $37,360 |
| 2018 | $687 | $43,360 | $6,000 | $37,360 |
| 2017 | $1,676 | $40,000 | $6,000 | $34,000 |
| 2016 | $697 | $39,120 | $6,000 | $33,120 |
| 2015 | $1,491 | $37,520 | $6,000 | $31,520 |
| 2014 | $1,503 | $36,760 | $0 | $0 |
Source: Public Records
Map
Nearby Homes