Estimated Value: $234,000 - $277,000
3
Beds
2
Baths
1,248
Sq Ft
$205/Sq Ft
Est. Value
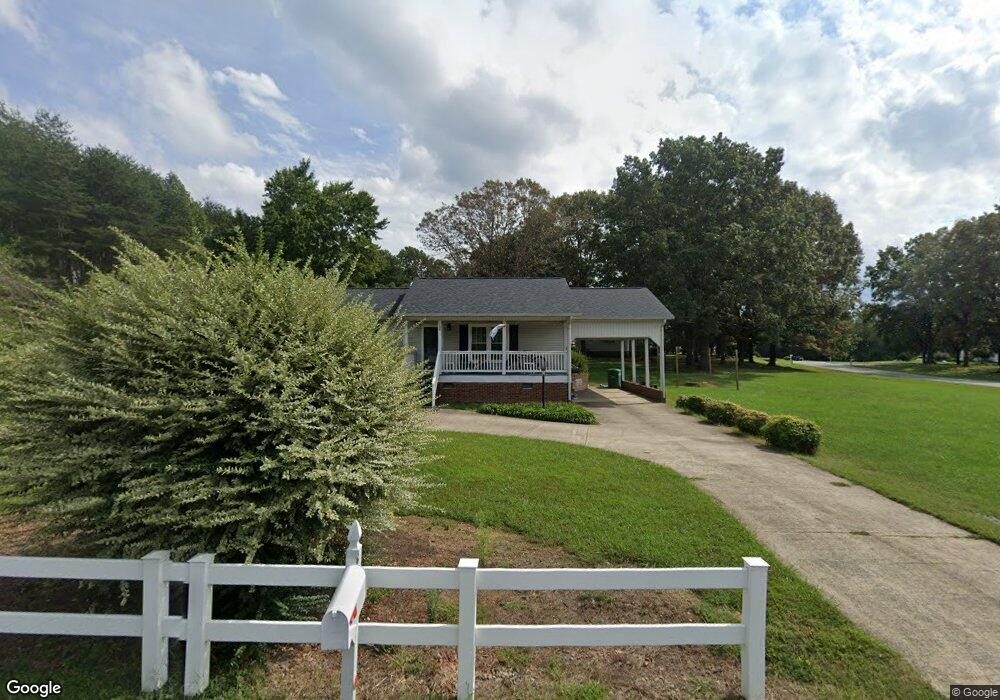
About This Home
This home is located at 130 Brandywine Dr, Eden, NC 27288 and is currently estimated at $256,194, approximately $205 per square foot. 130 Brandywine Dr is a home located in Rockingham County with nearby schools including Douglass Elementary School, J.E. Holmes Middle School, and John M. Morehead High School.
Ownership History
Date
Name
Owned For
Owner Type
Purchase Details
Closed on
May 23, 2014
Sold by
Federal National Mortgage Association
Bought by
Conner Jennifer M
Current Estimated Value
Home Financials for this Owner
Home Financials are based on the most recent Mortgage that was taken out on this home.
Original Mortgage
$84,000
Outstanding Balance
$64,422
Interest Rate
4.5%
Mortgage Type
Purchase Money Mortgage
Estimated Equity
$191,772
Purchase Details
Closed on
Apr 22, 2013
Sold by
Hussain Usama T and Hussain Laketta C
Bought by
Federal National Mortgage Association
Purchase Details
Closed on
Sep 28, 2007
Sold by
Boyte Elwood Ray and Boyte Ruth S
Bought by
Hussain Usama T and Hussain Laketta C
Home Financials for this Owner
Home Financials are based on the most recent Mortgage that was taken out on this home.
Original Mortgage
$140,000
Interest Rate
6.41%
Mortgage Type
New Conventional
Purchase Details
Closed on
Feb 23, 2006
Sold by
Boyte Elwood Ray and Boyte Ruth S
Bought by
Cipriani Rebecca B and Jones Kellie B
Create a Home Valuation Report for This Property
The Home Valuation Report is an in-depth analysis detailing your home's value as well as a comparison with similar homes in the area
Purchase History
| Date | Buyer | Sale Price | Title Company |
|---|---|---|---|
| Conner Jennifer M | -- | None Available | |
| Federal National Mortgage Association | $128,281 | None Available | |
| Hussain Usama T | $140,000 | None Available | |
| Cipriani Rebecca B | -- | None Available |
Source: Public Records
Mortgage History
| Date | Status | Borrower | Loan Amount |
|---|---|---|---|
| Open | Conner Jennifer M | $84,000 | |
| Previous Owner | Hussain Usama T | $140,000 |
Source: Public Records
Tax History
| Year | Tax Paid | Tax Assessment Tax Assessment Total Assessment is a certain percentage of the fair market value that is determined by local assessors to be the total taxable value of land and additions on the property. | Land | Improvement |
|---|---|---|---|---|
| 2025 | $1,484 | $224,852 | $41,472 | $183,380 |
| 2024 | $1,457 | $224,852 | $41,472 | $183,380 |
| 2023 | $1,457 | $127,090 | $23,040 | $104,050 |
| 2022 | $1,010 | $127,090 | $23,040 | $104,050 |
| 2021 | $1,010 | $127,090 | $23,040 | $104,050 |
| 2020 | $1,010 | $127,090 | $23,040 | $104,050 |
| 2019 | $1,010 | $127,090 | $23,040 | $104,050 |
| 2018 | $909 | $114,183 | $30,736 | $83,447 |
| 2017 | $909 | $114,183 | $30,736 | $83,447 |
| 2015 | $928 | $114,183 | $30,736 | $83,447 |
| 2014 | $909 | $114,183 | $30,736 | $83,447 |
Source: Public Records
Map
Nearby Homes
- 2282 Price Rd
- 122 Legrande Dr
- 145 Brightwood Rd
- 184 Brightwood Rd Unit Brightwood Road
- 0000 Price Rd
- 2631 Price Grange Rd
- 132 Circle Loop
- 118 Shady Grove Rd
- 00 Eden Rd
- 0 Eden Rd
- 272 Corn Tassell Trail
- 117 Brammer Rd
- 1312 Hillside Dr
- 000 Nc Highway 770
- 1226 Lewis St
- 198 Green Knolls Dr
- 0 Pine Rd
- 000 Price Rd
- 1200 Center Church Rd
- 1232 2nd St
- 00 Tanglebrook Trail
- 261 Tanglebrook Trail
- 123 Brandywine Dr
- 156 Brandywine Dr
- 250 Tanglebrook Trail
- 215 Tanglebrook Trail
- 270 Tanglebrook Trail
- 159 Brandywine Dr
- 201 Tanglebrook Trail
- 214 Tanglebrook Trail
- 2444 Price Rd
- 2472 Price Rd
- 285 Tanglebrook Trail
- 2391 Price Rd
- 176 Brandywine Dr
- 173 Brandywine Dr
- 200 Tanglebrook Trail
- 191 Tanglebrook Trail
- 142 Wimbish Rd
- 2482 Price Rd
Your Personal Tour Guide
Ask me questions while you tour the home.