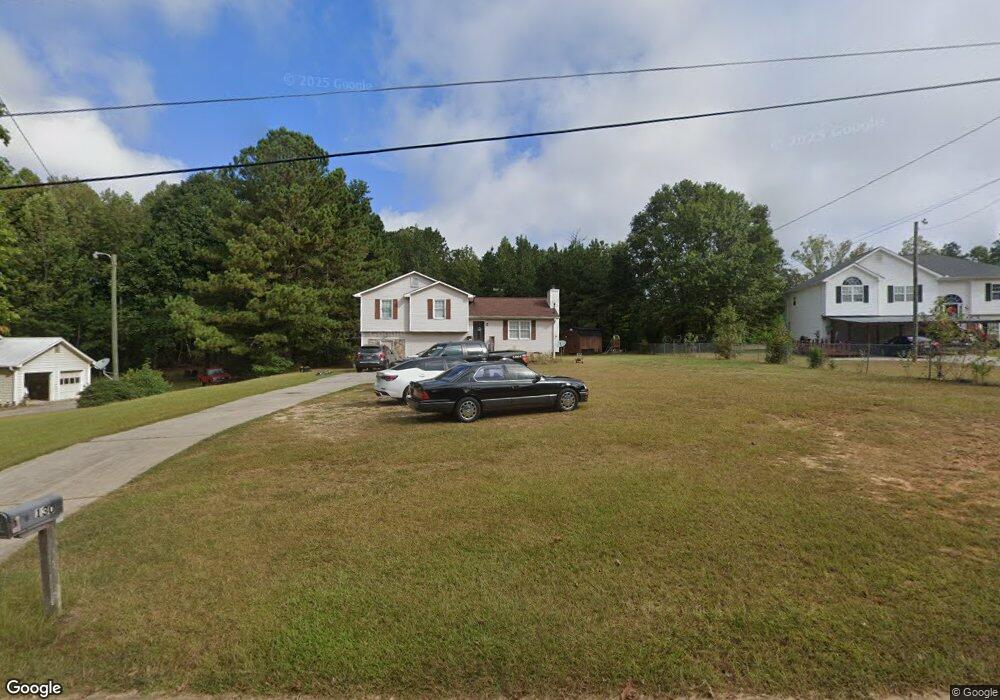
130 Brooke Way Carrollton, GA 30117
Estimated Value: $261,607 - $350,000
4
Beds
2
Baths
2,848
Sq Ft
$101/Sq Ft
Est. Value
About This Home
This home is located at 130 Brooke Way, Carrollton, GA 30117 and is currently estimated at $288,652, approximately $101 per square foot. 130 Brooke Way is a home located in Carroll County with nearby schools including Mt. Zion Elementary School, Mt. Zion Middle School, and Mt. Zion High School.
Ownership History
Date
Name
Owned For
Owner Type
Purchase Details
Closed on
Aug 29, 2016
Sold by
Robinson Jeanette
Bought by
Ward Daniel Allen
Current Estimated Value
Home Financials for this Owner
Home Financials are based on the most recent Mortgage that was taken out on this home.
Original Mortgage
$122,735
Outstanding Balance
$97,465
Interest Rate
3.25%
Mortgage Type
FHA
Estimated Equity
$191,187
Purchase Details
Closed on
Jan 28, 2016
Sold by
Robinson William W
Bought by
Robinson Jeanette
Purchase Details
Closed on
Nov 4, 2009
Sold by
Langley Charle
Bought by
Robinson W W
Purchase Details
Closed on
May 2, 2000
Sold by
Starling Allen L and Starling D
Bought by
Robinson W W
Purchase Details
Closed on
Aug 6, 1999
Sold by
Starling Dean and Cheryl Lea
Bought by
Starling Allen L and Starling D
Purchase Details
Closed on
Aug 31, 1997
Sold by
Robinson W W
Bought by
Starling Dean and Cheryl Lea
Create a Home Valuation Report for This Property
The Home Valuation Report is an in-depth analysis detailing your home's value as well as a comparison with similar homes in the area
Home Values in the Area
Average Home Value in this Area
Purchase History
| Date | Buyer | Sale Price | Title Company |
|---|---|---|---|
| Ward Daniel Allen | $125,000 | -- | |
| Robinson Jeanette | -- | -- | |
| Robinson W W | -- | -- | |
| Robinson W W | -- | -- | |
| Robinson W W | $85,000 | -- | |
| Starling Allen L | -- | -- | |
| Starling Dean | $79,000 | -- |
Source: Public Records
Mortgage History
| Date | Status | Borrower | Loan Amount |
|---|---|---|---|
| Open | Ward Daniel Allen | $122,735 |
Source: Public Records
Tax History Compared to Growth
Tax History
| Year | Tax Paid | Tax Assessment Tax Assessment Total Assessment is a certain percentage of the fair market value that is determined by local assessors to be the total taxable value of land and additions on the property. | Land | Improvement |
|---|---|---|---|---|
| 2024 | $2,865 | $98,633 | $7,000 | $91,633 |
| 2023 | $2,865 | $90,435 | $7,000 | $83,435 |
| 2022 | $2,356 | $73,335 | $7,000 | $66,335 |
| 2021 | $2,087 | $63,860 | $7,000 | $56,860 |
| 2020 | $1,467 | $57,156 | $7,000 | $50,156 |
| 2019 | $1,385 | $53,501 | $7,000 | $46,501 |
| 2018 | $1,249 | $47,568 | $7,000 | $40,568 |
| 2017 | $1,253 | $47,568 | $7,000 | $40,568 |
| 2016 | $1,293 | $49,059 | $7,000 | $42,059 |
| 2015 | $876 | $31,330 | $4,000 | $27,330 |
| 2014 | $803 | $28,597 | $4,000 | $24,597 |
Source: Public Records
Map
Nearby Homes
- 174 Katie Ln
- 68 Tyler Ln
- 142 Tyler Ln
- 898 Bowdon Junction Rd
- 14 Cole Lake Rd
- 469 Lee Williams Rd
- 112 Turkey Creek Trail
- 676 Hog Liver Rd
- 405 Adler Point
- The Thomas 2 Plan at Lambert Overlook
- The Thomas Plan at Lambert Overlook
- The Brook Plan at Lambert Overlook
- 266 Lambert Overlook Cir
- 313 Lucy Ln
- 00 Hog Liver Rd Unit 346
- 0 Hog Liver Rd Unit 148331
- 0 Hog Liver Rd Unit 10630257
- 0 Hog Liver Rd Unit 7671087
- 0 Hog Liver Rd Unit 10614601
- 0 Hog Liver Rd Unit 10630818
- 140 Brooke Way
- 118 Brooke Way
- 150 Brooke Way
- 104 Brooke Way
- 107 Brooke Way
- 127 Brooke Way
- 129 Brooke Way
- 94 Brooke Way
- 85 Brooke Way
- 84 Brooke Way
- 0 Brooke Way
- 1185 Bowdon Junction Rd
- 164 Katie Ln
- 1343 Bowdon Junction Rd
- 305 Katie Ln
- 142 Katie Ln Unit 16
- 142 Katie Ln
- 84 Katie Ln
- 0 Katie Ln Unit 8618329
- 0 Katie Ln Unit 7065573