130 Brownthrasher Run Unit 57 Oxford, GA 30054
Estimated Value: $540,690 - $603,000
--
Bed
4
Baths
3,046
Sq Ft
$187/Sq Ft
Est. Value
About This Home
This home is located at 130 Brownthrasher Run Unit 57, Oxford, GA 30054 and is currently estimated at $568,923, approximately $186 per square foot. 130 Brownthrasher Run Unit 57 is a home located in Newton County with nearby schools including Newton County Theme School at Ficquett, Cousins Middle School, and Newton High School.
Ownership History
Date
Name
Owned For
Owner Type
Purchase Details
Closed on
Apr 14, 2021
Sold by
Beeler Michael Jay
Bought by
Kennedy Emmry and Kennedy Jenea E
Current Estimated Value
Home Financials for this Owner
Home Financials are based on the most recent Mortgage that was taken out on this home.
Original Mortgage
$399,000
Outstanding Balance
$360,249
Interest Rate
3%
Mortgage Type
New Conventional
Estimated Equity
$208,674
Purchase Details
Closed on
Aug 7, 2020
Sold by
Kestner David W
Bought by
Kestner David W and Beeler Michael Jay
Home Financials for this Owner
Home Financials are based on the most recent Mortgage that was taken out on this home.
Original Mortgage
$363,301
Interest Rate
3%
Mortgage Type
New Conventional
Purchase Details
Closed on
Apr 24, 1998
Sold by
Roger A Wallace Inc
Bought by
Conoscienti Joseph A
Create a Home Valuation Report for This Property
The Home Valuation Report is an in-depth analysis detailing your home's value as well as a comparison with similar homes in the area
Home Values in the Area
Average Home Value in this Area
Purchase History
| Date | Buyer | Sale Price | Title Company |
|---|---|---|---|
| Kennedy Emmry | $420,000 | -- | |
| Kestner David W | -- | -- | |
| Kestner David W | $399,000 | -- | |
| Conoscienti Joseph A | $38,900 | -- |
Source: Public Records
Mortgage History
| Date | Status | Borrower | Loan Amount |
|---|---|---|---|
| Open | Kennedy Emmry | $399,000 | |
| Previous Owner | Kestner David W | $363,301 | |
| Closed | Conoscienti Joseph A | -- |
Source: Public Records
Tax History Compared to Growth
Tax History
| Year | Tax Paid | Tax Assessment Tax Assessment Total Assessment is a certain percentage of the fair market value that is determined by local assessors to be the total taxable value of land and additions on the property. | Land | Improvement |
|---|---|---|---|---|
| 2024 | $4,899 | $190,200 | $33,000 | $157,200 |
| 2023 | $4,937 | $178,960 | $24,200 | $154,760 |
| 2022 | $4,501 | $163,280 | $24,200 | $139,080 |
| 2021 | $4,845 | $157,440 | $22,000 | $135,440 |
| 2020 | $5,223 | $157,320 | $12,800 | $144,520 |
| 2019 | $4,864 | $144,480 | $12,800 | $131,680 |
| 2018 | $3,523 | $104,520 | $12,800 | $91,720 |
| 2017 | $3,283 | $97,520 | $10,000 | $87,520 |
| 2016 | $3,153 | $93,720 | $10,000 | $83,720 |
| 2015 | $2,972 | $88,480 | $10,000 | $78,480 |
| 2014 | $2,886 | $86,200 | $0 | $0 |
Source: Public Records
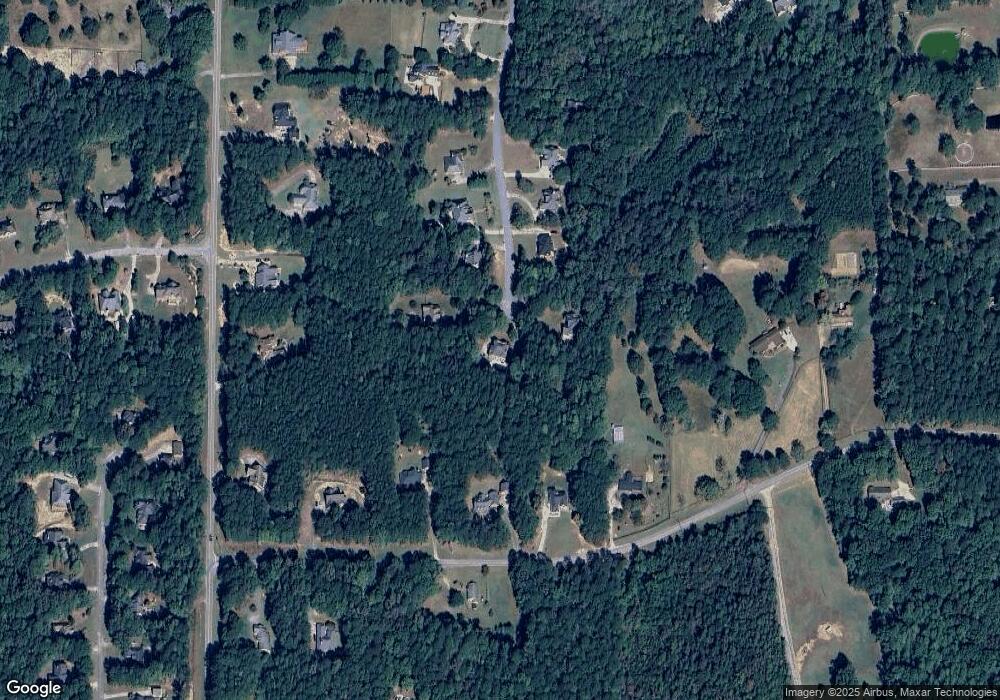
Map
Nearby Homes
- 55 Brownthrasher Run
- 20 Mockingbird Ln
- 10 Longview Dr
- 135 Magnolia Dr
- 69 Bald Rock Rd
- TRACT 30 Bald Rock Rd
- 125 Blue Grass Ct
- 30 Highlands Ln
- 15 Peejay Dr
- 45 Mountain Crest Dr
- 35 Highlands Way Unit 2
- 115 Blue Grass Way
- 349 Bald Rock Rd
- 25 Mountain Crest Dr
- 90 Oak Forest Dr
- 338 Mount Zion Rd
- 85 Highlands Way
- 332 Mount Zion Rd
- 1487 Mount Zion Rd
- 50 Highland Ridge Ln
- 130 Brownthrasher Run
- 130 Brown Thrasher Run Unit 57
- 120 Brown Thrasher Unit 58
- 120 Brown Thrasher
- 120 Brownthrasher Run Unit 58
- 120 Brownthrasher Run
- 125 Brownthrasher Run
- 125 Brown Thrasher Run
- 110 Brownthrasher Run
- 115 Brownthrasher Run
- 720 Edwards Rd
- 694 Edwards Rd
- 100 Brownthrasher Run
- 105 Brownthrasher Run
- 668 Edwards Rd
- 638 Edwards Rd
- 90 Brownthrasher Run
- 95 Brownthrasher Run
- 746 Edwards Rd
- 886 Mount Zion Rd