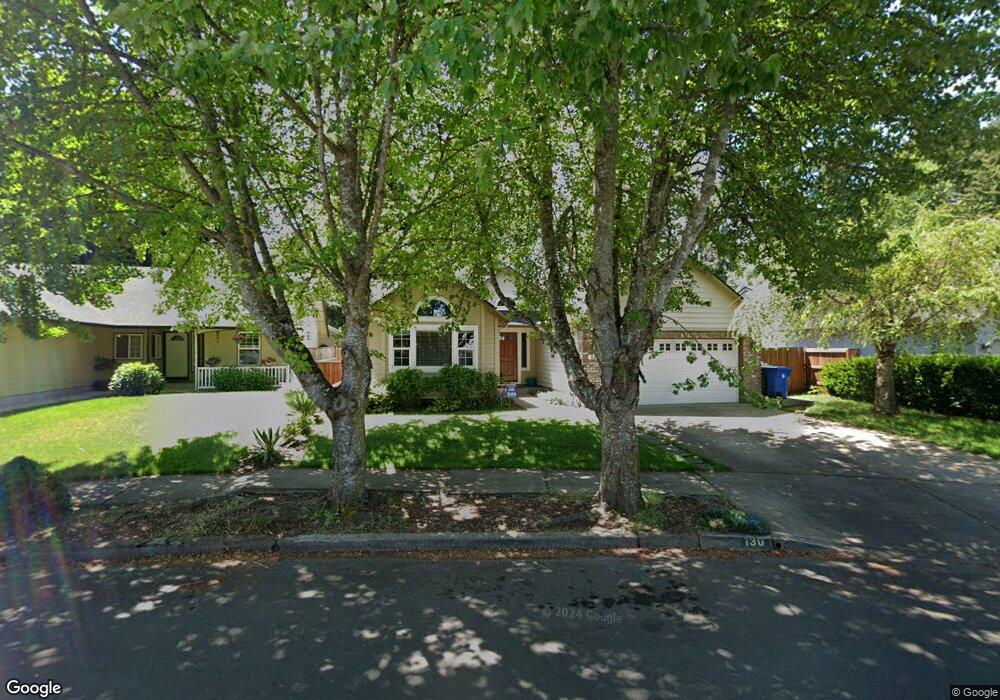
130 Calumet Ave Eugene, OR 97404
Santa Clara NeighborhoodEstimated Value: $457,793 - $517,000
3
Beds
2
Baths
1,484
Sq Ft
$332/Sq Ft
Est. Value
About This Home
This home is located at 130 Calumet Ave, Eugene, OR 97404 and is currently estimated at $491,948, approximately $331 per square foot. 130 Calumet Ave is a home located in Lane County with nearby schools including Awbrey Park Elementary School, Madison Middle School, and North Eugene High School.
Ownership History
Date
Name
Owned For
Owner Type
Purchase Details
Closed on
Jun 3, 2009
Sold by
Nelson Ryan and Nelson April M
Bought by
Nelson April
Current Estimated Value
Home Financials for this Owner
Home Financials are based on the most recent Mortgage that was taken out on this home.
Original Mortgage
$218,762
Outstanding Balance
$137,100
Interest Rate
4.78%
Mortgage Type
FHA
Estimated Equity
$354,848
Purchase Details
Closed on
Aug 28, 2007
Sold by
Lovorn Janet
Bought by
Nelson Ryan and Nelson April M
Home Financials for this Owner
Home Financials are based on the most recent Mortgage that was taken out on this home.
Original Mortgage
$209,920
Interest Rate
6.74%
Mortgage Type
Purchase Money Mortgage
Purchase Details
Closed on
Oct 28, 2005
Sold by
Lanning Marcus and Lanning Angela
Bought by
Lovorn Janet
Home Financials for this Owner
Home Financials are based on the most recent Mortgage that was taken out on this home.
Original Mortgage
$216,000
Interest Rate
5.68%
Mortgage Type
Fannie Mae Freddie Mac
Create a Home Valuation Report for This Property
The Home Valuation Report is an in-depth analysis detailing your home's value as well as a comparison with similar homes in the area
Home Values in the Area
Average Home Value in this Area
Purchase History
| Date | Buyer | Sale Price | Title Company |
|---|---|---|---|
| Nelson April | -- | Cascade Title Co | |
| Nelson Ryan | $262,400 | Cascade Title Co | |
| Lovorn Janet | $240,000 | Cascade Title Co |
Source: Public Records
Mortgage History
| Date | Status | Borrower | Loan Amount |
|---|---|---|---|
| Open | Nelson April | $218,762 | |
| Closed | Nelson Ryan | $209,920 | |
| Previous Owner | Lovorn Janet | $216,000 |
Source: Public Records
Tax History
| Year | Tax Paid | Tax Assessment Tax Assessment Total Assessment is a certain percentage of the fair market value that is determined by local assessors to be the total taxable value of land and additions on the property. | Land | Improvement |
|---|---|---|---|---|
| 2025 | $5,362 | $275,216 | -- | -- |
| 2024 | $5,296 | $267,200 | -- | -- |
| 2023 | $5,296 | $259,418 | $0 | $0 |
| 2022 | $4,961 | $251,863 | $0 | $0 |
| 2021 | $4,660 | $244,528 | $0 | $0 |
| 2020 | $4,609 | $237,406 | $0 | $0 |
| 2019 | $4,405 | $230,492 | $0 | $0 |
| 2018 | $4,108 | $217,261 | $0 | $0 |
| 2017 | $3,822 | $217,261 | $0 | $0 |
| 2016 | $3,643 | $210,933 | $0 | $0 |
| 2015 | $3,522 | $204,789 | $0 | $0 |
| 2014 | $3,423 | $198,824 | $0 | $0 |
Source: Public Records
Map
Nearby Homes
- 4366 Berry Ln
- 110 Calumet Ave
- 4471 Spring Meadow Ave
- 4483 Thunderbird St
- 47 van Fossen Ct
- 4795 Thunderbird St
- 4490 Doyle St
- 90 Daniel Dr
- 212 Chimney Rock Ln
- 528 Nottingham Ave
- 514 Warrington Ave
- 355 River Loop 2
- 329 Dean Ave
- 850 E Beacon Dr
- 709 Tyson Ln
- 591 Argon Ave
- 4278 Torrington Ave
- 556 Cinderella Loop
- 3985 Shenstone Dr
- 420 Lynnbrook Dr
- 128 Calumet Cir
- 128 Calumet Cir
- 134 Calumet Ave
- 124 Calumet Cir
- 138 Calumet Ave
- 129 Calumet Ave
- 4450 Spring Meadow Ave
- 133 Calumet Ave
- 4379 Berry Ln
- 135 Calumet Ave
- 122 Calumet Cir
- 4436 Spring Meadow Ave
- 4390 Berry Ln
- 118 Calumet Cir
- 4363 Berry Ln
- 4521 Sedona Dr
- 4382 Berry Ln
- 110 Calumet Cir
- 4518 Spring Meadow Ave
- 4410 Spring Meadow Ave
Your Personal Tour Guide
Ask me questions while you tour the home.