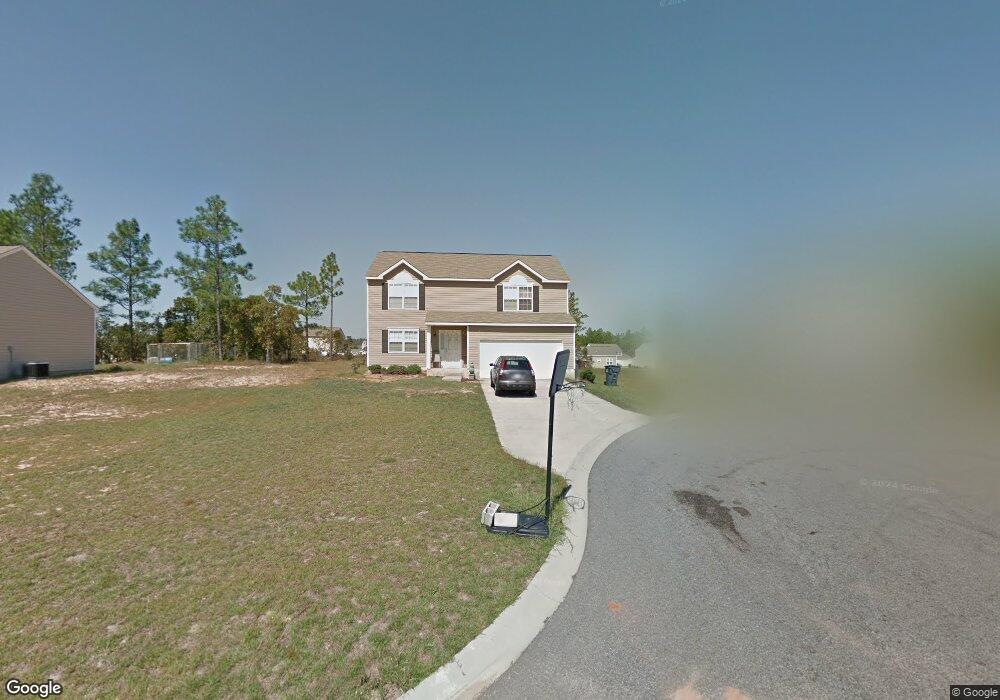
130 Cranbrook Ct Gaston, SC 29053
Estimated Value: $242,000 - $263,000
4
Beds
3
Baths
1,932
Sq Ft
$131/Sq Ft
Est. Value
About This Home
This home is located at 130 Cranbrook Ct, Gaston, SC 29053 and is currently estimated at $252,836, approximately $130 per square foot. 130 Cranbrook Ct is a home located in Lexington County with nearby schools including Herbert A. Wood Elementary School, Pine Ridge Middle School, and Airport High School.
Ownership History
Date
Name
Owned For
Owner Type
Purchase Details
Closed on
Jun 22, 2016
Sold by
Wilmington Savings Fund Society Fsb
Bought by
Whitten Riley
Current Estimated Value
Home Financials for this Owner
Home Financials are based on the most recent Mortgage that was taken out on this home.
Original Mortgage
$106,837
Interest Rate
3.5%
Mortgage Type
FHA
Purchase Details
Closed on
Dec 28, 2015
Sold by
Stephens Lucenda V
Bought by
Wilmington Savings Fund Society Fsb
Purchase Details
Closed on
Oct 26, 2007
Sold by
Nvr Rymarc Homes Of South Carolina Llc
Bought by
Stephens Lucenda Vanessa
Home Financials for this Owner
Home Financials are based on the most recent Mortgage that was taken out on this home.
Original Mortgage
$129,256
Interest Rate
6.37%
Mortgage Type
FHA
Purchase Details
Closed on
Jul 19, 2007
Sold by
Mcleod Development
Bought by
Nvr Rymarc Homes Of South Carolina Llc
Create a Home Valuation Report for This Property
The Home Valuation Report is an in-depth analysis detailing your home's value as well as a comparison with similar homes in the area
Home Values in the Area
Average Home Value in this Area
Purchase History
| Date | Buyer | Sale Price | Title Company |
|---|---|---|---|
| Whitten Riley | -- | None Available | |
| Wilmington Savings Fund Society Fsb | -- | -- | |
| Stephens Lucenda Vanessa | $131,285 | None Available | |
| Nvr Rymarc Homes Of South Carolina Llc | $59,250 | None Available |
Source: Public Records
Mortgage History
| Date | Status | Borrower | Loan Amount |
|---|---|---|---|
| Previous Owner | Whitten Riley | $106,837 | |
| Previous Owner | Stephens Lucenda Vanessa | $129,256 |
Source: Public Records
Tax History
| Year | Tax Paid | Tax Assessment Tax Assessment Total Assessment is a certain percentage of the fair market value that is determined by local assessors to be the total taxable value of land and additions on the property. | Land | Improvement |
|---|---|---|---|---|
| 2024 | $820 | $5,376 | $1,200 | $4,176 |
| 2023 | $762 | $5,376 | $1,200 | $4,176 |
| 2020 | $759 | $5,376 | $1,200 | $4,176 |
| 2019 | $720 | $4,996 | $880 | $4,116 |
| 2018 | $730 | $4,996 | $880 | $4,116 |
| 2017 | $703 | $4,996 | $880 | $4,116 |
| 2016 | $2,107 | $6,831 | $1,320 | $5,511 |
| 2014 | $516 | $5,232 | $880 | $4,352 |
| 2013 | -- | $5,230 | $880 | $4,350 |
Source: Public Records
Map
Nearby Homes
- 224 Heather Ridge Dr
- 111 Allenvalley Rd
- 325 Silver Spur Way
- 617 Rustic Cabin Ln
- 602 Rustic Cabin Ln
- 847 Nilo Farms Way
- 621 Rustic Cabin Ln
- 816 Nilo Farms Way
- 331 Silver Spur Way
- 725 Old Wire Rd
- 212 Paula Ct
- 719 Glider Dr
- 724 Glider Dr
- 627 Richmond Rd
- 608 Richmond Rd
- 723 Glider Dr
- 1973 Glenn Rd
- 144 Gillins Terrace Rd
- 720 Glider Dr
- 442 Savany Hunt Creek Rd
- 126 Cranbrook Ct
- 134 Cranbrook Ct
- 122 Cranbrook Ct
- 138 Cranbrook Ct
- 336 Woodcote Dr
- 118 Cranbrook Ct
- 123 Cranbrook Ct
- 142 Cranbrook Ct
- 131 Cranbrook Ct
- 127 Cranbrook Ct
- 139 Cranbrook Ct
- 135 Cranbrook Ct
- 332 Woodcote Dr
- 340 Woodcote Dr
- 117 Cranbrook Ct
- 114 Cranbrook Ct
- 328 Woodcote Dr
- 146 Cranbrook Ct
- 143 Cranbrook Ct
- 324 Woodcote Dr
Your Personal Tour Guide
Ask me questions while you tour the home.