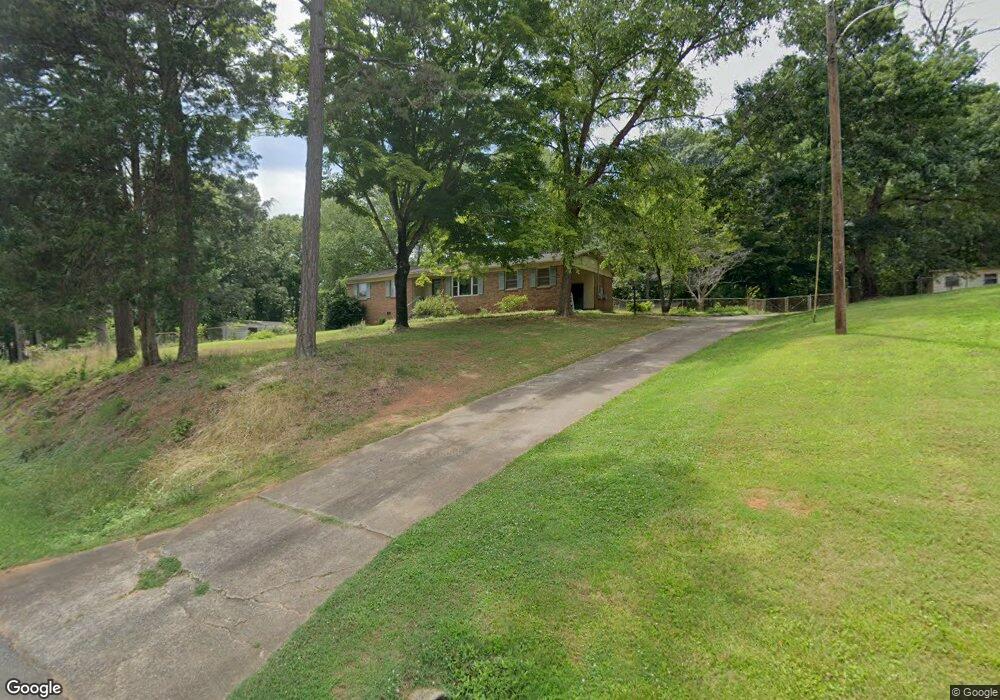
130 Delmar Rd Shelby, NC 28152
Estimated Value: $169,000 - $199,633
--
Bed
--
Bath
1,587
Sq Ft
$115/Sq Ft
Est. Value
About This Home
This home is located at 130 Delmar Rd, Shelby, NC 28152 and is currently estimated at $182,158, approximately $114 per square foot. 130 Delmar Rd is a home located in Cleveland County with nearby schools including Marion Intermediate School, Shelby Middle School, and Shelby High School.
Ownership History
Date
Name
Owned For
Owner Type
Purchase Details
Closed on
Jun 17, 2025
Sold by
Tedesco John A and Tedesco Lori E
Bought by
Kiser Kyle Steven and Kiser Ivan Guerrero
Current Estimated Value
Home Financials for this Owner
Home Financials are based on the most recent Mortgage that was taken out on this home.
Original Mortgage
$136,000
Outstanding Balance
$135,551
Interest Rate
5.5%
Mortgage Type
New Conventional
Estimated Equity
$46,607
Purchase Details
Closed on
Jul 23, 2014
Sold by
Kiser Cynthia N
Bought by
Tedesco John A and Tedesco Lori E
Home Financials for this Owner
Home Financials are based on the most recent Mortgage that was taken out on this home.
Original Mortgage
$75,600
Interest Rate
4.26%
Mortgage Type
New Conventional
Purchase Details
Closed on
Jul 1, 2014
Sold by
Kiser Jerry Dean and Kiser Juanita
Bought by
Tedesco John A and Tedesco Lori E
Home Financials for this Owner
Home Financials are based on the most recent Mortgage that was taken out on this home.
Original Mortgage
$75,600
Interest Rate
4.26%
Mortgage Type
New Conventional
Create a Home Valuation Report for This Property
The Home Valuation Report is an in-depth analysis detailing your home's value as well as a comparison with similar homes in the area
Home Values in the Area
Average Home Value in this Area
Purchase History
| Date | Buyer | Sale Price | Title Company |
|---|---|---|---|
| Kiser Kyle Steven | $170,000 | None Listed On Document | |
| Tedesco John A | -- | None Available | |
| Tedesco John A | $94,500 | None Available |
Source: Public Records
Mortgage History
| Date | Status | Borrower | Loan Amount |
|---|---|---|---|
| Open | Kiser Kyle Steven | $136,000 | |
| Previous Owner | Tedesco John A | $75,600 |
Source: Public Records
Tax History Compared to Growth
Tax History
| Year | Tax Paid | Tax Assessment Tax Assessment Total Assessment is a certain percentage of the fair market value that is determined by local assessors to be the total taxable value of land and additions on the property. | Land | Improvement |
|---|---|---|---|---|
| 2025 | $1,051 | $170,887 | $19,683 | $151,204 |
| 2024 | $893 | $104,827 | $19,683 | $85,144 |
| 2023 | $888 | $104,827 | $19,683 | $85,144 |
| 2022 | $888 | $104,827 | $19,683 | $85,144 |
| 2021 | $890 | $104,827 | $19,683 | $85,144 |
| 2020 | $1,020 | $117,148 | $19,683 | $97,465 |
| 2019 | $1,020 | $117,148 | $19,683 | $97,465 |
| 2018 | $1,015 | $117,148 | $19,683 | $97,465 |
| 2017 | $1,010 | $117,148 | $19,683 | $97,465 |
| 2016 | $964 | $117,148 | $19,683 | $97,465 |
| 2015 | $902 | $109,035 | $11,416 | $97,619 |
| 2014 | $910 | $110,162 | $12,543 | $97,619 |
Source: Public Records
Map
Nearby Homes
- 118 Delmar Rd
- 302 Kimberlee Dr
- 912 Kearney Dr
- 1302 Earl Rd
- 229 Lake George Dr
- 1307 Tiffany Ln
- 910 Mcgowan Rd
- 908 Mcgowan Rd
- 907 Mcgowan Rd
- 00000 Pamela Dr
- 0000 Pamela Dr
- 000 Pamela Dr
- 00 Pamela Dr
- 0 Pamela Dr
- 1203 Pamela Dr
- 830 Cabaniss Dr
- 3007 Drake Cir
- 3005 Drake Cir
- 3009 Drake Center
- 202 Kenwood Dr