Estimated Value: $333,000 - $512,000
--
Bed
--
Bath
1,590
Sq Ft
$256/Sq Ft
Est. Value
About This Home
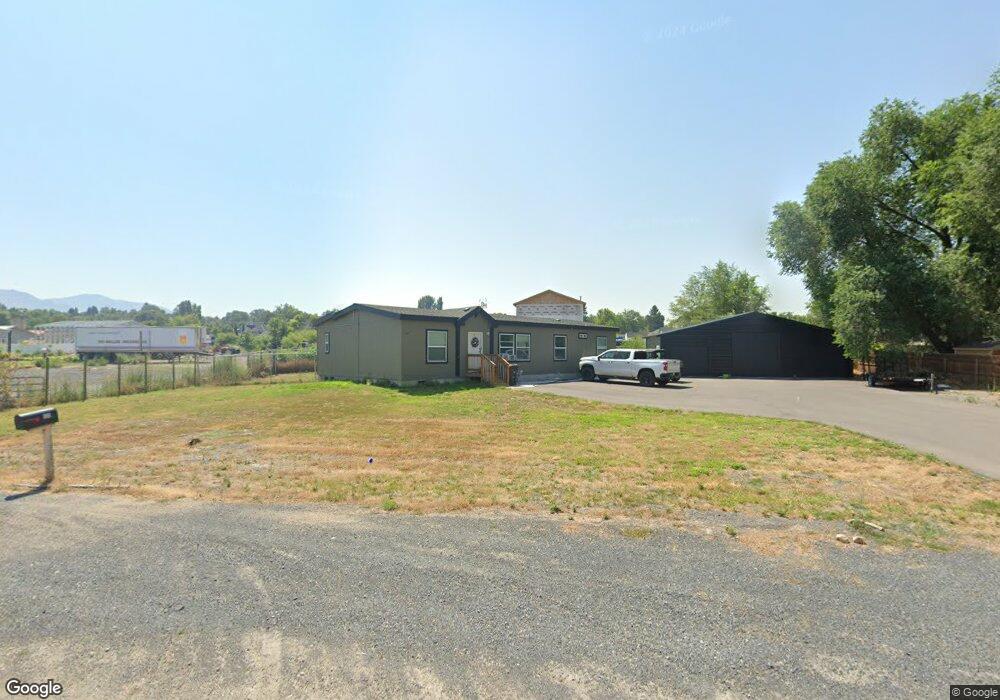
This home is located at 130 E 200 N, Hyrum, UT 84319 and is currently estimated at $407,172, approximately $256 per square foot. 130 E 200 N is a home with nearby schools including Lincoln School, South Cache Middle School, and Mountain Crest High School.
Ownership History
Date
Name
Owned For
Owner Type
Purchase Details
Closed on
Feb 23, 2021
Sold by
Factory Homes Outlet Inc
Bought by
Riley Tera and Low James V
Current Estimated Value
Home Financials for this Owner
Home Financials are based on the most recent Mortgage that was taken out on this home.
Original Mortgage
$230,260
Outstanding Balance
$205,472
Interest Rate
2.7%
Mortgage Type
FHA
Estimated Equity
$201,700
Purchase Details
Closed on
Jul 27, 2020
Sold by
White Denton and White Analyn
Bought by
Factory Homes Outlet Inc
Purchase Details
Closed on
Jun 19, 2019
Sold by
White Denton and White Analyn
Bought by
White Denton and White Anaklyn
Purchase Details
Closed on
Sep 20, 2018
Sold by
Ba Miller Properties Llc
Bought by
White Denton and White Analyn
Purchase Details
Closed on
Nov 2, 2010
Sold by
Bosch Alyce
Bought by
Ba Miller Properties Llc
Purchase Details
Closed on
May 11, 2009
Sold by
Miller Benjamin M and Miller Alexis Ann
Bought by
Bosch Alyce
Create a Home Valuation Report for This Property
The Home Valuation Report is an in-depth analysis detailing your home's value as well as a comparison with similar homes in the area
Home Values in the Area
Average Home Value in this Area
Purchase History
| Date | Buyer | Sale Price | Title Company |
|---|---|---|---|
| Riley Tera | -- | Northern Title Company | |
| Factory Homes Outlet Inc | -- | Cache Title Logan | |
| White Denton | -- | Cache Title Company Inc | |
| White Denton | -- | Cache Title Logan | |
| White Denton | -- | Cache Title Logan | |
| Ba Miller Properties Llc | -- | None Available | |
| Bosch Alyce | -- | Cache Title Company Inc |
Source: Public Records
Mortgage History
| Date | Status | Borrower | Loan Amount |
|---|---|---|---|
| Open | Riley Tera | $230,260 |
Source: Public Records
Tax History Compared to Growth
Tax History
| Year | Tax Paid | Tax Assessment Tax Assessment Total Assessment is a certain percentage of the fair market value that is determined by local assessors to be the total taxable value of land and additions on the property. | Land | Improvement |
|---|---|---|---|---|
| 2025 | $1,094 | $157,110 | $0 | $0 |
| 2024 | $1,196 | $160,340 | $0 | $0 |
| 2023 | $1,153 | $147,805 | $0 | $0 |
| 2022 | $121 | $148,440 | $0 | $0 |
| 2021 | $1,163 | $220,090 | $66,890 | $153,200 |
| 2020 | $685 | $66,890 | $66,890 | $0 |
| 2019 | $414 | $38,000 | $38,000 | $0 |
| 2018 | $428 | $38,000 | $38,000 | $0 |
| 2017 | $453 | $38,000 | $0 | $0 |
| 2016 | $464 | $38,000 | $0 | $0 |
| 2015 | $465 | $38,000 | $0 | $0 |
| 2014 | $451 | $37,700 | $0 | $0 |
| 2013 | -- | $37,700 | $0 | $0 |
Source: Public Records
Map
Nearby Homes