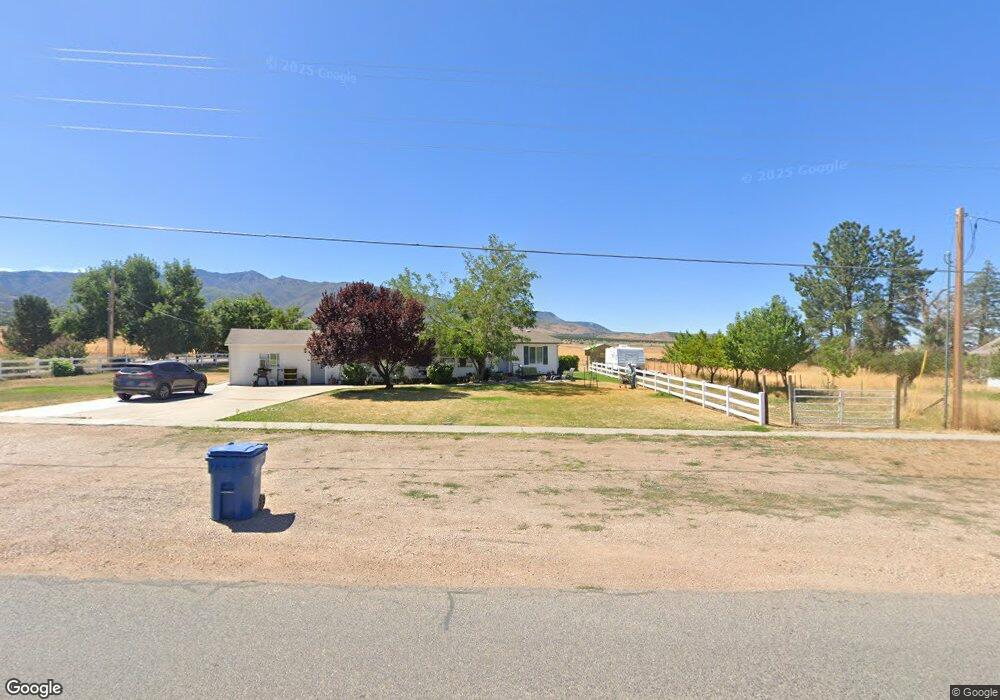
130 E 500 S Fillmore, UT 84631
Estimated Value: $298,000 - $413,000
3
Beds
2
Baths
1,683
Sq Ft
$202/Sq Ft
Est. Value
About This Home
This home is located at 130 E 500 S, Fillmore, UT 84631 and is currently estimated at $339,428, approximately $201 per square foot. 130 E 500 S is a home located in Millard County.
Ownership History
Date
Name
Owned For
Owner Type
Purchase Details
Closed on
Apr 21, 2025
Sold by
Wright Robert Warren and Brinkerhoff Wright Alta
Bought by
Robert And Alta Wright Living Trust and Wright
Current Estimated Value
Purchase Details
Closed on
Aug 26, 2024
Sold by
Wright Robert Warren and Brinkerhoff Wright Alta
Bought by
Wright Robert Warren and Brinkerhoff Wright Alta
Purchase Details
Closed on
Dec 12, 2018
Sold by
Pentz Zane W and Pentz Staci T
Bought by
Finlinson Mark and Finlinson Mandy
Purchase Details
Closed on
Mar 25, 2016
Sold by
Finlinson Katie Julie
Bought by
Finlinson Jacob D
Home Financials for this Owner
Home Financials are based on the most recent Mortgage that was taken out on this home.
Original Mortgage
$124,300
Interest Rate
3.65%
Mortgage Type
New Conventional
Purchase Details
Closed on
Dec 9, 2013
Sold by
Barton Joy C
Bought by
Finlinson Jacob D and Finlinson Katie Julie
Home Financials for this Owner
Home Financials are based on the most recent Mortgage that was taken out on this home.
Original Mortgage
$116,500
Interest Rate
4.04%
Create a Home Valuation Report for This Property
The Home Valuation Report is an in-depth analysis detailing your home's value as well as a comparison with similar homes in the area
Home Values in the Area
Average Home Value in this Area
Purchase History
| Date | Buyer | Sale Price | Title Company |
|---|---|---|---|
| Robert And Alta Wright Living Trust | -- | None Listed On Document | |
| Robert And Alta Wright Living Trust | -- | None Listed On Document | |
| Wright Robert Warren | -- | None Listed On Document | |
| Finlinson Mark | -- | -- | |
| Finlinson Jacob D | -- | First American Title | |
| Finlinson Jacob D | -- | -- |
Source: Public Records
Mortgage History
| Date | Status | Borrower | Loan Amount |
|---|---|---|---|
| Previous Owner | Finlinson Jacob D | $124,300 | |
| Previous Owner | Finlinson Jacob D | $116,500 |
Source: Public Records
Tax History
| Year | Tax Paid | Tax Assessment Tax Assessment Total Assessment is a certain percentage of the fair market value that is determined by local assessors to be the total taxable value of land and additions on the property. | Land | Improvement |
|---|---|---|---|---|
| 2025 | $1,166 | $146,398 | $34,060 | $112,338 |
| 2024 | $1,166 | $124,555 | $26,288 | $98,267 |
| 2023 | $1,361 | $124,555 | $26,288 | $98,267 |
| 2022 | $1,186 | $106,483 | $23,898 | $82,585 |
| 2021 | $1,024 | $88,323 | $15,518 | $72,805 |
| 2020 | $946 | $82,024 | $14,108 | $67,916 |
| 2019 | $943 | $82,024 | $14,108 | $67,916 |
| 2018 | $769 | $68,440 | $14,108 | $54,332 |
| 2017 | $728 | $61,642 | $14,108 | $47,534 |
| 2016 | $697 | $61,642 | $14,108 | $47,534 |
| 2015 | $697 | $61,642 | $14,108 | $47,534 |
| 2014 | -- | $58,922 | $14,108 | $44,814 |
| 2013 | -- | $58,922 | $14,108 | $44,814 |
Source: Public Records
Map
Nearby Homes
- 155 E 500 St S
- 157 E 500 South St
- 405 E 500 St S
- 465 S 100 W
- 235 S 200 St E
- 760 E 700 St S
- 430 E Canyon Rd
- 690 E 500 S
- 40 S 100 Rd E
- 260 W 200 S
- 775 E Valley View Rd
- 155 W Center St
- 351 W 100 South St
- 750 800 South Fillmore
- 825 800 South Fillmore
- 800 800 South Fillmore
- 75 N 100 West St
- 310 S 500 West Rd
- 225 W 200 St N
- 245 W 300 N
Your Personal Tour Guide
Ask me questions while you tour the home.