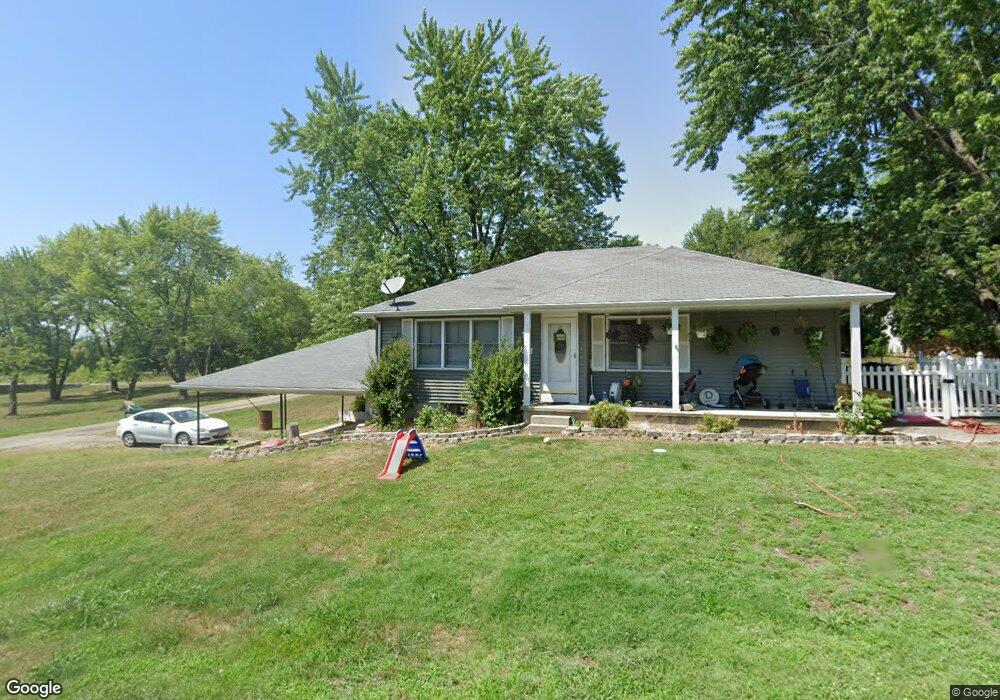
130 Eldridge St Osceola, MO 64776
Estimated Value: $100,842 - $206,000
2
Beds
--
Bath
1,108
Sq Ft
$143/Sq Ft
Est. Value
About This Home
This home is located at 130 Eldridge St, Osceola, MO 64776 and is currently estimated at $158,711, approximately $143 per square foot. 130 Eldridge St is a home with nearby schools including Osceola Elementary School and Osceola Junior/Senior High School.
Ownership History
Date
Name
Owned For
Owner Type
Purchase Details
Closed on
Jul 31, 2025
Sold by
Shepherd Chantz R and Shepherd Whitney A
Bought by
Schmucker Gayle
Current Estimated Value
Purchase Details
Closed on
Jun 26, 2018
Sold by
Schmucker Gayle
Bought by
Shepherd Chantz R and Shepherd Whitney A
Purchase Details
Closed on
Jul 2, 2012
Sold by
Jamieson Saralee
Bought by
Shepherd Chantz R and Shepherd Whitney A
Home Financials for this Owner
Home Financials are based on the most recent Mortgage that was taken out on this home.
Original Mortgage
$60,000
Interest Rate
3.8%
Mortgage Type
New Conventional
Create a Home Valuation Report for This Property
The Home Valuation Report is an in-depth analysis detailing your home's value as well as a comparison with similar homes in the area
Home Values in the Area
Average Home Value in this Area
Purchase History
| Date | Buyer | Sale Price | Title Company |
|---|---|---|---|
| Schmucker Gayle | -- | None Listed On Document | |
| Shepherd Chantz R | -- | None Available | |
| Shepherd Chantz R | -- | None Available |
Source: Public Records
Mortgage History
| Date | Status | Borrower | Loan Amount |
|---|---|---|---|
| Previous Owner | Shepherd Chantz R | $60,000 |
Source: Public Records
Tax History Compared to Growth
Tax History
| Year | Tax Paid | Tax Assessment Tax Assessment Total Assessment is a certain percentage of the fair market value that is determined by local assessors to be the total taxable value of land and additions on the property. | Land | Improvement |
|---|---|---|---|---|
| 2024 | $753 | $11,900 | $0 | $0 |
| 2023 | $749 | $11,900 | $0 | $0 |
| 2022 | $742 | $11,900 | $0 | $0 |
| 2021 | $741 | $11,900 | $0 | $0 |
| 2020 | $730 | $11,600 | $0 | $0 |
| 2019 | $727 | $11,600 | $0 | $0 |
| 2018 | $728 | $11,600 | $0 | $0 |
| 2017 | $645 | $9,700 | $0 | $0 |
| 2016 | $648 | $9,700 | $0 | $0 |
| 2015 | $645 | $9,700 | $0 | $0 |
| 2014 | -- | $9,900 | $0 | $0 |
| 2013 | -- | $8,900 | $0 | $0 |
Source: Public Records
Map
Nearby Homes