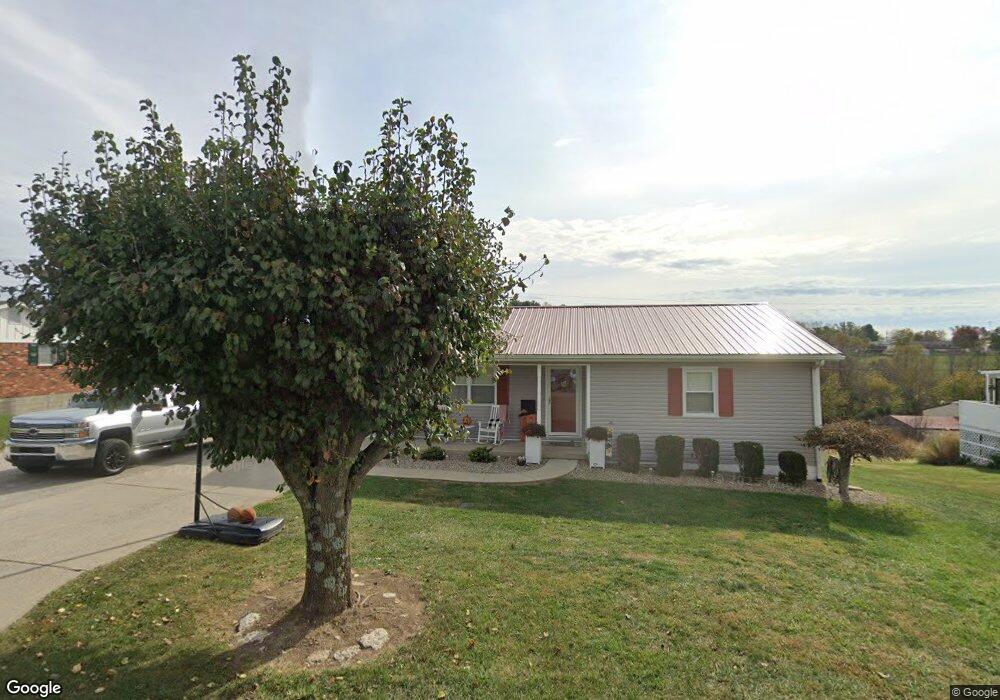
130 Emmons Ln Flemingsburg, KY 41041
Estimated Value: $153,000 - $213,000
3
Beds
1
Bath
1,020
Sq Ft
$169/Sq Ft
Est. Value
About This Home
This home is located at 130 Emmons Ln, Flemingsburg, KY 41041 and is currently estimated at $172,177, approximately $168 per square foot. 130 Emmons Ln is a home located in Fleming County with nearby schools including Fleming County High School.
Ownership History
Date
Name
Owned For
Owner Type
Purchase Details
Closed on
Jul 29, 2025
Sold by
J T H Holdings Llc
Bought by
Mcglone Kevin B and Mcglone Sasha N
Current Estimated Value
Purchase Details
Closed on
Sep 26, 2014
Sold by
Shirley Mae Shirley Mae and Lewis Shirley Mae
Bought by
Mcglone Kevin B and Mcglone Sasha N
Purchase Details
Closed on
Mar 8, 2013
Sold by
Hunt Sybille B and Mcglone Monica
Bought by
Mcglone Kevin B and Mcglone Sasha N
Home Financials for this Owner
Home Financials are based on the most recent Mortgage that was taken out on this home.
Original Mortgage
$85,204
Interest Rate
3.56%
Purchase Details
Closed on
Sep 2, 2008
Sold by
Cropper Travis and Cropper Gidget H
Bought by
Hunt Sybille B
Purchase Details
Closed on
Feb 28, 2005
Sold by
Rader Jeanie
Bought by
Cropper Travis and High Gidget L
Home Financials for this Owner
Home Financials are based on the most recent Mortgage that was taken out on this home.
Original Mortgage
$60,000
Interest Rate
5.09%
Create a Home Valuation Report for This Property
The Home Valuation Report is an in-depth analysis detailing your home's value as well as a comparison with similar homes in the area
Home Values in the Area
Average Home Value in this Area
Purchase History
| Date | Buyer | Sale Price | Title Company |
|---|---|---|---|
| Mcglone Kevin B | $2,000 | None Listed On Document | |
| Mcglone Kevin B | $2,000 | None Listed On Document | |
| Mcglone Kevin B | $4,000 | -- | |
| Mcglone Kevin B | $80,000 | -- | |
| Hunt Sybille B | $76,000 | -- | |
| Cropper Travis | $65,000 | -- |
Source: Public Records
Mortgage History
| Date | Status | Borrower | Loan Amount |
|---|---|---|---|
| Previous Owner | Mcglone Kevin B | $85,204 | |
| Previous Owner | Cropper Travis | $60,000 |
Source: Public Records
Tax History Compared to Growth
Tax History
| Year | Tax Paid | Tax Assessment Tax Assessment Total Assessment is a certain percentage of the fair market value that is determined by local assessors to be the total taxable value of land and additions on the property. | Land | Improvement |
|---|---|---|---|---|
| 2025 | $1,129 | $101,000 | $16,000 | $85,000 |
| 2024 | $1,139 | $101,000 | $16,000 | $85,000 |
| 2023 | $1,012 | $101,000 | $16,000 | $85,000 |
| 2022 | $840 | $84,000 | $16,000 | $68,000 |
| 2021 | $864 | $84,000 | $16,000 | $68,000 |
| 2020 | $866 | $84,000 | $16,000 | $68,000 |
| 2019 | $855 | $84,000 | $16,000 | $68,000 |
| 2018 | $814 | $84,000 | $16,000 | $68,000 |
| 2017 | $813 | $84,000 | $16,000 | $68,000 |
| 2016 | $811 | $84,000 | $16,000 | $68,000 |
| 2015 | $806 | $84,000 | $16,000 | $68,000 |
| 2012 | $686 | $76,000 | $12,000 | $64,000 |
Source: Public Records
Map
Nearby Homes
- 0 Cherry Grove Rd
- 61 Emmons Ln
- 57 Dorothy St
- 205 Highridge Dr
- 904 W Water St
- 19 Russell St
- 330 Crest Ave
- 659 Cherry Grove Rd
- 115 Highland Dr
- 294 W Water St
- 294 W West Water St
- 128 Crestview Rd
- 133 Tulip Poplar - Lot 5 Ln
- 70 Sunflower Rd
- 3775 Mount Carmel Rd
- 222 Mary Ave
- 528 Foxspring Ave
- 44 Lawrence Ln
- 232 Mills Ave
- 243 Stewart St