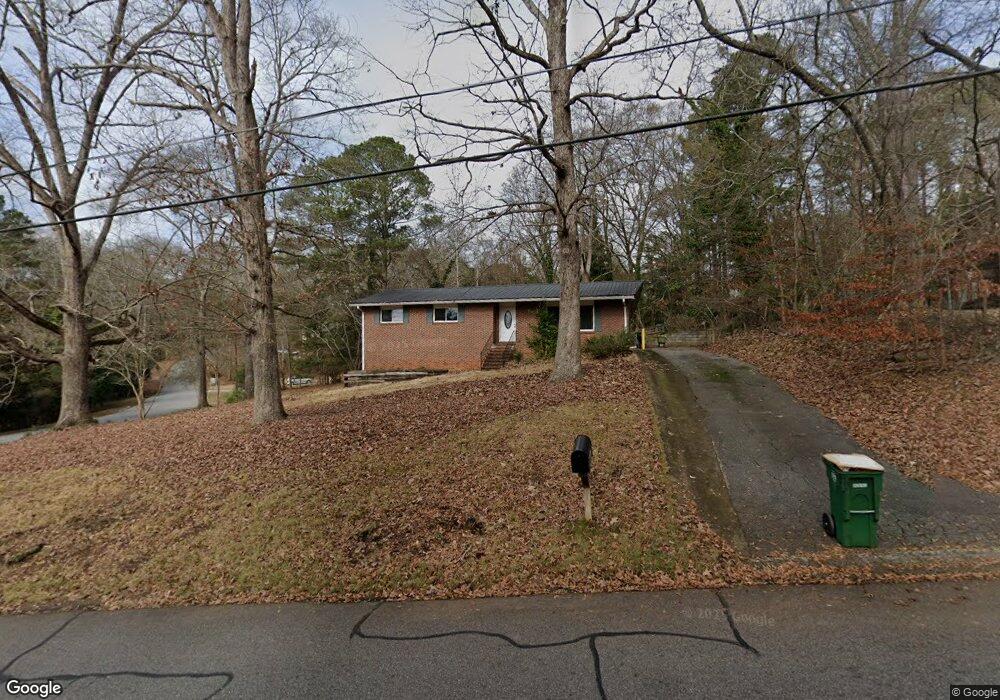
130 Ferncliff Dr Athens, GA 30606
Forest Heights NeighborhoodEstimated Value: $339,262 - $353,000
3
Beds
3
Baths
3,080
Sq Ft
$112/Sq Ft
Est. Value
About This Home
This home is located at 130 Ferncliff Dr, Athens, GA 30606 and is currently estimated at $345,316, approximately $112 per square foot. 130 Ferncliff Dr is a home located in Clarke County with nearby schools including Oglethorpe Avenue Elementary School, Burney-Harris-Lyons Middle School, and Clarke Central High School.
Ownership History
Date
Name
Owned For
Owner Type
Purchase Details
Closed on
Feb 28, 2011
Sold by
Gray John Christopher
Bought by
Grove Brad P
Current Estimated Value
Home Financials for this Owner
Home Financials are based on the most recent Mortgage that was taken out on this home.
Original Mortgage
$95,899
Outstanding Balance
$65,287
Interest Rate
4.75%
Mortgage Type
FHA
Estimated Equity
$280,029
Purchase Details
Closed on
Mar 30, 2010
Sold by
Vickery Marty Lee
Bought by
Gray John Christopher
Home Financials for this Owner
Home Financials are based on the most recent Mortgage that was taken out on this home.
Original Mortgage
$112,917
Interest Rate
4.87%
Mortgage Type
FHA
Purchase Details
Closed on
Jul 31, 1989
Sold by
Mullins David E
Bought by
Vickery Marty Lee and Vickery Lori A
Create a Home Valuation Report for This Property
The Home Valuation Report is an in-depth analysis detailing your home's value as well as a comparison with similar homes in the area
Home Values in the Area
Average Home Value in this Area
Purchase History
| Date | Buyer | Sale Price | Title Company |
|---|---|---|---|
| Grove Brad P | $105,500 | -- | |
| Gray John Christopher | $115,000 | -- | |
| Vickery Marty Lee | $64,000 | -- |
Source: Public Records
Mortgage History
| Date | Status | Borrower | Loan Amount |
|---|---|---|---|
| Open | Gray John Christopher | $95,899 | |
| Previous Owner | Gray John Christopher | $112,917 |
Source: Public Records
Tax History Compared to Growth
Tax History
| Year | Tax Paid | Tax Assessment Tax Assessment Total Assessment is a certain percentage of the fair market value that is determined by local assessors to be the total taxable value of land and additions on the property. | Land | Improvement |
|---|---|---|---|---|
| 2025 | $3,186 | $121,676 | $18,000 | $103,676 |
| 2024 | $3,186 | $113,718 | $18,000 | $95,718 |
| 2023 | $2,223 | $106,139 | $14,000 | $92,139 |
| 2022 | $2,531 | $89,344 | $14,000 | $75,344 |
| 2021 | $2,325 | $79,000 | $14,000 | $65,000 |
| 2020 | $2,068 | $71,373 | $14,000 | $57,373 |
| 2019 | $1,890 | $65,682 | $12,000 | $53,682 |
| 2018 | $1,830 | $63,898 | $11,200 | $52,698 |
| 2017 | $1,454 | $52,827 | $11,200 | $41,627 |
| 2016 | $1,400 | $51,227 | $9,600 | $41,627 |
| 2015 | $1,147 | $43,722 | $8,000 | $35,722 |
| 2014 | $1,051 | $40,857 | $8,000 | $32,857 |
Source: Public Records
Map
Nearby Homes
- 135 Tara Way
- 330 Stoneland Dr
- 809 Forest Heights Dr
- 225 Sherwood Dr
- 347 Hampton Park Dr
- 607 Creekside Ct
- 105 Westchester Dr Unit A8
- 105 Westchester Dr Unit A8
- 105 Westchester Dr Unit E5
- 205 Tremont Cir
- 140 Breckenridge Ln
- 185 Landor Dr
- 107 Berkeshire Ct
- 275 Westchester Cir
- 104 Westchester Cir Unit 4
- 119 E Surry Ct
- 120 Ferncliff Dr
- 210 Ferncliff Dr
- 175 Rivermont Rd
- 100 Pine Forest Dr
- 215 Rivermont Rd
- 603 Forest Heights Dr
- 165 Rivermont Rd
- 205 Ferncliff Dr
- 601 Forest Heights Dr
- 220 Ferncliff Dr
- 605 Forest Heights Dr
- 765 Pine Forest Dr
- 160 Rivermont Rd
- 215 Ferncliff Dr
- 225 Rivermont Rd
- 230 Ferncliff Dr
- 755 Pine Forest Dr
- 701 Forest Heights Dr
- 125 Rivermont Rd
- 602 Forest Heights Dr