130 Fremont St Elkhart, IN 46516
South Shore-Bridge Street NeighborhoodEstimated Value: $134,000 - $157,662
3
Beds
2
Baths
2,356
Sq Ft
$60/Sq Ft
Est. Value
About This Home
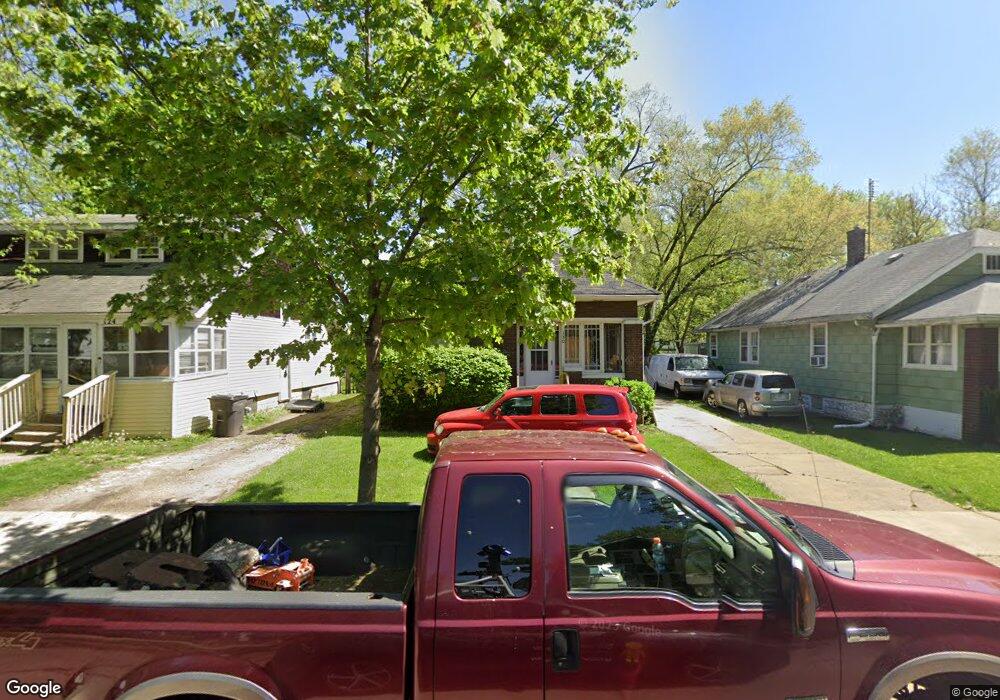
This home is located at 130 Fremont St, Elkhart, IN 46516 and is currently estimated at $142,166, approximately $60 per square foot. 130 Fremont St is a home located in Elkhart County with nearby schools including Mary Daly Elementary School, West Side Middle School, and Elkhart High School.
Ownership History
Date
Name
Owned For
Owner Type
Purchase Details
Closed on
Aug 2, 2019
Sold by
Marian L Troyer Living Trust
Bought by
Troyer Zachary
Current Estimated Value
Home Financials for this Owner
Home Financials are based on the most recent Mortgage that was taken out on this home.
Original Mortgage
$28,000
Outstanding Balance
$24,468
Interest Rate
3.8%
Mortgage Type
New Conventional
Estimated Equity
$117,698
Purchase Details
Closed on
Oct 6, 2014
Sold by
Troyer Marian L
Bought by
Troyer Marian L
Purchase Details
Closed on
Jun 16, 2011
Sold by
Secretary Of Housing & Urban Development
Bought by
Troyer Marian L
Purchase Details
Closed on
Jan 4, 2011
Sold by
James B Nutter & Company
Bought by
Secretary Of Housing & Urban Development
Purchase Details
Closed on
Dec 29, 2010
Sold by
Gomez Concepcion
Bought by
James B Nutter & Company
Create a Home Valuation Report for This Property
The Home Valuation Report is an in-depth analysis detailing your home's value as well as a comparison with similar homes in the area
Home Values in the Area
Average Home Value in this Area
Purchase History
| Date | Buyer | Sale Price | Title Company |
|---|---|---|---|
| Troyer Zachary | $37,240 | None Listed On Document | |
| Troyer Marian L | -- | None Available | |
| Troyer Marian L | -- | Contract Processing & Title | |
| Secretary Of Housing & Urban Development | $81,504 | None Available | |
| James B Nutter & Company | $81,504 | None Available |
Source: Public Records
Mortgage History
| Date | Status | Borrower | Loan Amount |
|---|---|---|---|
| Open | Troyer Zachary | $28,000 |
Source: Public Records
Tax History Compared to Growth
Tax History
| Year | Tax Paid | Tax Assessment Tax Assessment Total Assessment is a certain percentage of the fair market value that is determined by local assessors to be the total taxable value of land and additions on the property. | Land | Improvement |
|---|---|---|---|---|
| 2024 | $1,004 | $99,500 | $9,700 | $89,800 |
| 2022 | $875 | $88,200 | $9,700 | $78,500 |
| 2021 | $714 | $82,000 | $9,700 | $72,300 |
| 2020 | $582 | $74,700 | $9,700 | $65,000 |
| 2019 | $623 | $67,400 | $9,700 | $57,700 |
| 2018 | $642 | $68,100 | $9,700 | $58,400 |
| 2017 | $392 | $39,400 | $9,700 | $29,700 |
| 2016 | $381 | $38,600 | $9,700 | $28,900 |
| 2014 | $345 | $36,400 | $9,700 | $26,700 |
| 2013 | $376 | $38,200 | $9,700 | $28,500 |
Source: Public Records
Map
Nearby Homes
- 1202 S Shore Dr
- 1309 Harrison St
- 1301 Harrison St
- 726 W Lexington Ave
- 124 S Vine St
- 1021 Strong Ave
- 1007 Mason St
- 709 Strong Ave
- 100 S Michigan St
- 1106 Strong Ave
- 311 Hillside Ct
- 721 Harrison St
- 915 Fulton St
- 00000 W Lexington Ave
- 607 W Marion St
- 154 N 6th St
- 1637 Rainbow Bend Blvd
- 1803 W Indiana Ave
- 626 Bower St
- 419 W High St