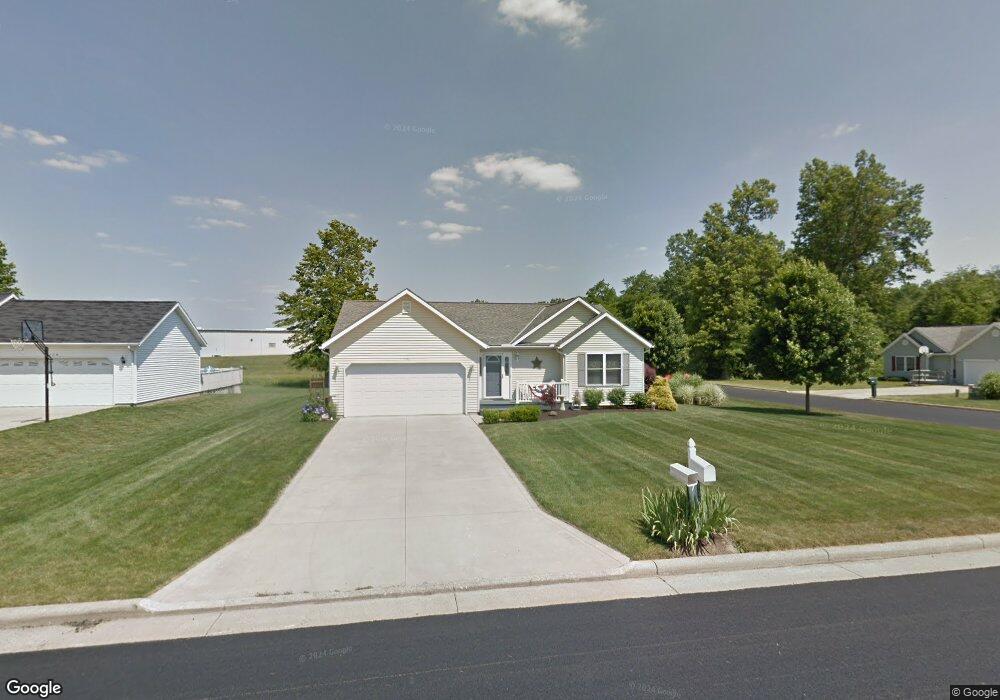
130 Hazel Dr Ontario, OH 44906
Estimated Value: $238,563 - $271,000
3
Beds
2
Baths
1,402
Sq Ft
$183/Sq Ft
Est. Value
About This Home
This home is located at 130 Hazel Dr, Ontario, OH 44906 and is currently estimated at $257,141, approximately $183 per square foot. 130 Hazel Dr is a home located in Richland County with nearby schools including Stingel Elementary School, Ontario Middle School, and Ontario High School.
Ownership History
Date
Name
Owned For
Owner Type
Purchase Details
Closed on
Jun 29, 2021
Sold by
Collins Larry C
Bought by
Collins Michael S and Collins Mark S
Current Estimated Value
Purchase Details
Closed on
May 23, 2017
Sold by
Collins Beverly G and Collins Lary C
Bought by
Collins Larry C
Purchase Details
Closed on
Jun 22, 2006
Sold by
Ahrens Mark R
Bought by
Collins Larry C and Collins Beverly G
Home Financials for this Owner
Home Financials are based on the most recent Mortgage that was taken out on this home.
Original Mortgage
$82,000
Outstanding Balance
$26,805
Interest Rate
6.72%
Mortgage Type
Purchase Money Mortgage
Estimated Equity
$230,336
Purchase Details
Closed on
Jun 6, 2003
Sold by
Gem Development Inc
Bought by
Ahrens Mark R
Home Financials for this Owner
Home Financials are based on the most recent Mortgage that was taken out on this home.
Original Mortgage
$123,950
Outstanding Balance
$54,690
Interest Rate
5.88%
Mortgage Type
Purchase Money Mortgage
Estimated Equity
$202,451
Purchase Details
Closed on
Sep 27, 1995
Sold by
Mccoy Lowell L
Bought by
Gem Dev Inc
Create a Home Valuation Report for This Property
The Home Valuation Report is an in-depth analysis detailing your home's value as well as a comparison with similar homes in the area
Home Values in the Area
Average Home Value in this Area
Purchase History
| Date | Buyer | Sale Price | Title Company |
|---|---|---|---|
| Collins Michael S | -- | None Available | |
| Collins Larry C | -- | None Available | |
| Collins Larry C | $141,000 | Chicago Title | |
| Ahrens Mark R | $130,525 | Southern Title | |
| Gem Dev Inc | $200,000 | -- |
Source: Public Records
Mortgage History
| Date | Status | Borrower | Loan Amount |
|---|---|---|---|
| Open | Collins Larry C | $82,000 | |
| Open | Ahrens Mark R | $123,950 |
Source: Public Records
Tax History Compared to Growth
Tax History
| Year | Tax Paid | Tax Assessment Tax Assessment Total Assessment is a certain percentage of the fair market value that is determined by local assessors to be the total taxable value of land and additions on the property. | Land | Improvement |
|---|---|---|---|---|
| 2024 | $2,950 | $69,000 | $13,760 | $55,240 |
| 2023 | $2,950 | $69,000 | $13,760 | $55,240 |
| 2022 | $2,307 | $48,590 | $10,700 | $37,890 |
| 2021 | $2,311 | $48,590 | $10,700 | $37,890 |
| 2020 | $2,467 | $48,590 | $10,700 | $37,890 |
| 2019 | $2,219 | $41,180 | $9,070 | $32,110 |
| 2018 | $1,884 | $41,180 | $9,070 | $32,110 |
| 2017 | $1,894 | $41,180 | $9,070 | $32,110 |
| 2016 | $1,935 | $42,390 | $8,790 | $33,600 |
| 2015 | $1,935 | $42,390 | $8,790 | $33,600 |
| 2014 | $1,937 | $42,390 | $8,790 | $33,600 |
| 2012 | $915 | $43,710 | $9,070 | $34,640 |
Source: Public Records
Map
Nearby Homes
- 1996 Park Ave W
- 99 Scotland Blvd
- 175 Maple Ln
- 2585 Deerfield Ln
- 720 Lindaire Ln E
- 1431 Silver Ln
- 1496 W 4th St
- 2281 Park Ave W
- 0 Millsboro Rd Unit 9067349
- 0 Millsboro Rd Unit 9066844
- 1947 Teakwood Dr
- 204 Lasalle St
- 2007 Teakwood Dr
- 1915 Teakwood Dr Unit 1915
- 1909 Teakwood Dr
- 147 Wimbledon Dr
- 2010 Teakwood Dr
- 125 Hilltop Rd
- 405 Maple Ln Unit 405 & 407
- 230 Clare Rd
- 138 Hazel Dr
- 1853 August Dr
- 144 Hazel Dr
- 1876 August Dr
- 0 Old Mill Run
- 1861 August Dr
- 1869 August Dr
- 1884 August Dr
- 141 Hazel Dr
- 1877 August Dr
- 1885 August Dr
- 1894 August Dr
- 1900 August Dr
- 56 Sunset Rd Unit 58
- 58 Sunset Rd N Unit 58 Sunset
- 1887 August Dr
- 1908 August Dr
- 50 Sunset Rd
- 1897 August Dr
- 1914 August Dr