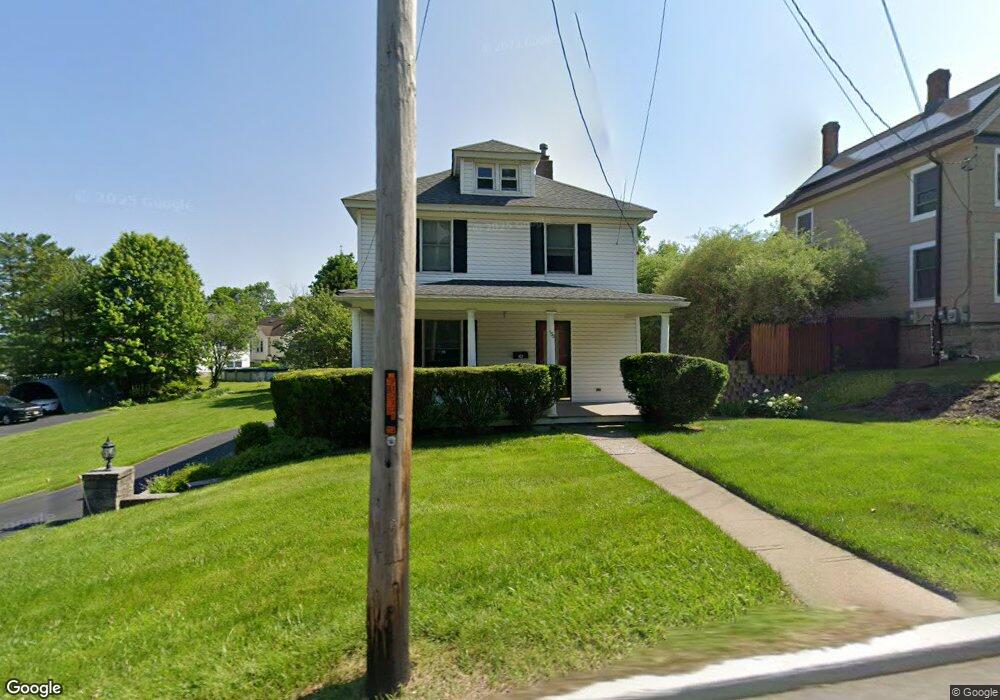
130 High St Newton, NJ 07860
Estimated Value: $330,958 - $393,000
--
Bed
--
Bath
1,344
Sq Ft
$270/Sq Ft
Est. Value
About This Home
This home is located at 130 High St, Newton, NJ 07860 and is currently estimated at $363,240, approximately $270 per square foot. 130 High St is a home located in Sussex County with nearby schools including Merriam Avenue School, Halsted Street Middle School, and Newton High School.
Ownership History
Date
Name
Owned For
Owner Type
Purchase Details
Closed on
Aug 29, 2023
Sold by
Chase Warren J and Chase Margaret L
Bought by
Chase Margaret L
Current Estimated Value
Purchase Details
Closed on
Aug 6, 2012
Sold by
Chase Warren J and Chase Margret L
Bought by
Chase Warren J and Chase Margaret L
Create a Home Valuation Report for This Property
The Home Valuation Report is an in-depth analysis detailing your home's value as well as a comparison with similar homes in the area
Home Values in the Area
Average Home Value in this Area
Purchase History
| Date | Buyer | Sale Price | Title Company |
|---|---|---|---|
| Chase Margaret L | -- | None Listed On Document | |
| Chase Margaret L | -- | None Listed On Document | |
| Chase Warren J | -- | None Listed On Document | |
| Chase Warren J | -- | None Listed On Document | |
| Chase Warren J | -- | None Available |
Source: Public Records
Tax History Compared to Growth
Tax History
| Year | Tax Paid | Tax Assessment Tax Assessment Total Assessment is a certain percentage of the fair market value that is determined by local assessors to be the total taxable value of land and additions on the property. | Land | Improvement |
|---|---|---|---|---|
| 2025 | $7,267 | $282,600 | $71,100 | $211,500 |
| 2024 | $7,271 | $266,500 | $59,900 | $206,600 |
| 2023 | $7,271 | $161,800 | $55,700 | $106,100 |
| 2022 | $7,300 | $161,800 | $55,700 | $106,100 |
| 2021 | $7,268 | $161,800 | $55,700 | $106,100 |
| 2020 | $7,156 | $161,800 | $55,700 | $106,100 |
| 2019 | $6,935 | $161,800 | $55,700 | $106,100 |
| 2018 | $6,898 | $161,800 | $55,700 | $106,100 |
| 2017 | $6,857 | $161,800 | $55,700 | $106,100 |
| 2016 | $6,747 | $161,800 | $55,700 | $106,100 |
| 2015 | $6,569 | $161,800 | $55,700 | $106,100 |
| 2014 | $6,433 | $161,800 | $55,700 | $106,100 |
Source: Public Records
Map
Nearby Homes