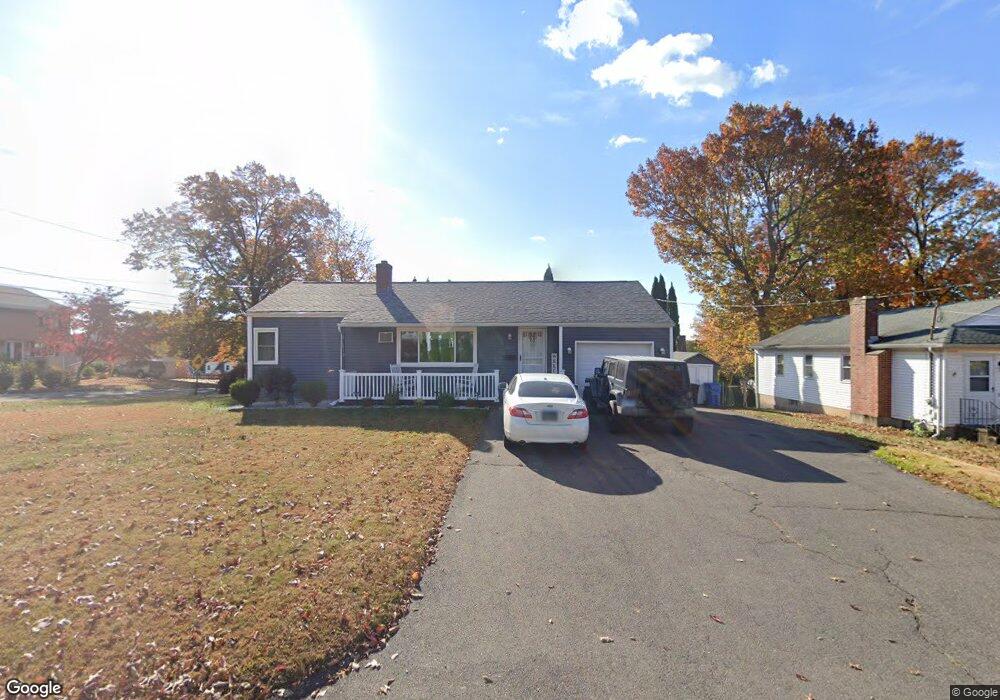
130 Hillhurst Ave New Britain, CT 06053
Estimated Value: $243,000 - $288,000
2
Beds
1
Bath
960
Sq Ft
$274/Sq Ft
Est. Value
About This Home
This home is located at 130 Hillhurst Ave, New Britain, CT 06053 and is currently estimated at $263,052, approximately $274 per square foot. 130 Hillhurst Ave is a home located in Hartford County with nearby schools including Gaffney School and Slade Middle School.
Ownership History
Date
Name
Owned For
Owner Type
Purchase Details
Closed on
Aug 11, 2015
Sold by
Karimeddini David S
Bought by
Martinez Keysha and Martinez Migdalia
Current Estimated Value
Home Financials for this Owner
Home Financials are based on the most recent Mortgage that was taken out on this home.
Original Mortgage
$116,844
Outstanding Balance
$91,394
Interest Rate
4.03%
Mortgage Type
FHA
Estimated Equity
$171,658
Purchase Details
Closed on
Aug 5, 2008
Sold by
Renaud Lucien H and Renaud Marilyn
Bought by
Karimeddini David S
Home Financials for this Owner
Home Financials are based on the most recent Mortgage that was taken out on this home.
Original Mortgage
$104,800
Interest Rate
5.5%
Purchase Details
Closed on
Jun 22, 1998
Sold by
Fnma
Bought by
Renaud Lucien H
Home Financials for this Owner
Home Financials are based on the most recent Mortgage that was taken out on this home.
Original Mortgage
$58,500
Interest Rate
7.09%
Mortgage Type
Purchase Money Mortgage
Create a Home Valuation Report for This Property
The Home Valuation Report is an in-depth analysis detailing your home's value as well as a comparison with similar homes in the area
Home Values in the Area
Average Home Value in this Area
Purchase History
| Date | Buyer | Sale Price | Title Company |
|---|---|---|---|
| Martinez Keysha | $119,000 | -- | |
| Karimeddini David S | $131,000 | -- | |
| Renaud Lucien H | $65,000 | -- |
Source: Public Records
Mortgage History
| Date | Status | Borrower | Loan Amount |
|---|---|---|---|
| Open | Martinez Keysha | $116,844 | |
| Previous Owner | Renaud Lucien H | $104,800 | |
| Previous Owner | Renaud Lucien H | $58,500 |
Source: Public Records
Tax History
| Year | Tax Paid | Tax Assessment Tax Assessment Total Assessment is a certain percentage of the fair market value that is determined by local assessors to be the total taxable value of land and additions on the property. | Land | Improvement |
|---|---|---|---|---|
| 2025 | $4,536 | $115,780 | $56,630 | $59,150 |
| 2024 | $4,584 | $115,780 | $56,630 | $59,150 |
| 2023 | $4,432 | $115,780 | $56,630 | $59,150 |
| 2022 | $3,694 | $74,620 | $26,110 | $48,510 |
| 2021 | $3,694 | $74,620 | $26,110 | $48,510 |
| 2020 | $3,768 | $74,620 | $26,110 | $48,510 |
| 2019 | $3,768 | $74,620 | $26,110 | $48,510 |
| 2018 | $3,694 | $73,150 | $26,110 | $47,040 |
| 2017 | $3,447 | $68,250 | $21,770 | $46,480 |
| 2016 | $3,447 | $68,250 | $21,770 | $46,480 |
| 2015 | $3,344 | $68,250 | $21,770 | $46,480 |
| 2014 | $3,066 | $62,580 | $21,770 | $40,810 |
Source: Public Records
Map
Nearby Homes
- 230 Hillhurst Ave
- 240 Hillhurst Ave
- 19 Maplehurst Ave
- 54 Fairlane Dr
- 37 Richard St
- 7 Ledyard Rd
- 134 Russwin Rd
- 25 Clinton St
- 527 Burritt St
- 234 Pierremount Ave
- 164 Curtis St
- 77 Booth St
- 18 Woodruff Ct
- 266 Grove St
- 33 Colt St
- 80 Gold St
- 94 Pennsylvania Ave
- 134 Black Rock Ave
- 962 Corbin Ave
- 55 Allen St
- 188 Pershing Ave
- 140 Hillhurst Ave
- 144 Hillhurst Ave
- 206 Pershing Ave
- 116 Hillhurst Ave
- 185 Pershing Ave
- 141 Hillhurst Ave
- 150 Hillhurst Ave
- 115 Pinehurst Ave
- 212 Pershing Ave
- 121 Pinehurst Ave
- 121 Pinehurst Ave Unit Second Floor
- 121 Pinehurst Ave Unit 2nd flr
- 17 Rome St
- 154 Hillhurst Ave
- 93 Pinehurst Ave
- 115 Hillhurst Ave
- 127 Pinehurst Ave
- 108 Hillhurst Ave
- 23 Rome St
Your Personal Tour Guide
Ask me questions while you tour the home.