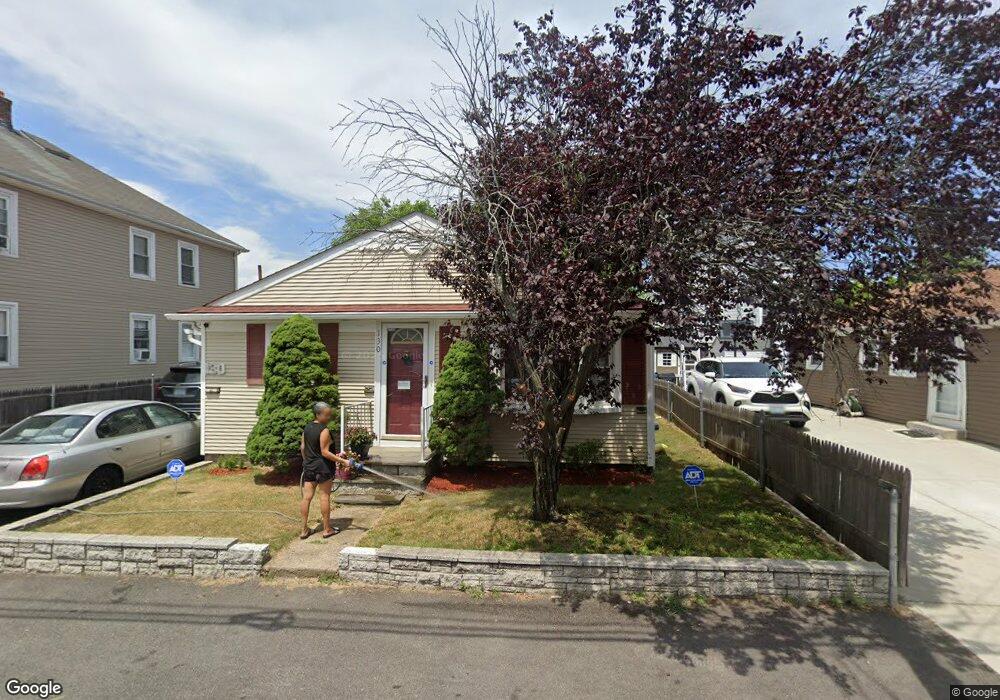
130 John St Pawtucket, RI 02861
Darlington NeighborhoodEstimated Value: $338,000 - $390,000
3
Beds
1
Bath
1,488
Sq Ft
$249/Sq Ft
Est. Value
About This Home
This home is located at 130 John St, Pawtucket, RI 02861 and is currently estimated at $371,195, approximately $249 per square foot. 130 John St is a home located in Providence County with nearby schools including St Cecilia School and Saint Raphael Academy.
Ownership History
Date
Name
Owned For
Owner Type
Purchase Details
Closed on
Jun 28, 2004
Sold by
Dossantos Benunda
Bought by
Glaude Susan
Current Estimated Value
Home Financials for this Owner
Home Financials are based on the most recent Mortgage that was taken out on this home.
Original Mortgage
$185,250
Interest Rate
6.32%
Mortgage Type
Purchase Money Mortgage
Purchase Details
Closed on
Nov 30, 1994
Sold by
Dipaola Rocco and Dipaola Virginia
Bought by
Glaude Susan M
Create a Home Valuation Report for This Property
The Home Valuation Report is an in-depth analysis detailing your home's value as well as a comparison with similar homes in the area
Home Values in the Area
Average Home Value in this Area
Purchase History
| Date | Buyer | Sale Price | Title Company |
|---|---|---|---|
| Glaude Susan | $195,000 | -- | |
| Glaude Susan M | $90,000 | -- |
Source: Public Records
Mortgage History
| Date | Status | Borrower | Loan Amount |
|---|---|---|---|
| Open | Glaude Susan M | $249,850 | |
| Closed | Glaude Susan M | $185,250 | |
| Previous Owner | Glaude Susan M | $66,650 |
Source: Public Records
Tax History Compared to Growth
Tax History
| Year | Tax Paid | Tax Assessment Tax Assessment Total Assessment is a certain percentage of the fair market value that is determined by local assessors to be the total taxable value of land and additions on the property. | Land | Improvement |
|---|---|---|---|---|
| 2025 | $3,737 | $284,200 | $111,600 | $172,600 |
| 2024 | $3,507 | $284,200 | $111,600 | $172,600 |
| 2023 | $3,834 | $226,300 | $85,900 | $140,400 |
| 2022 | $3,752 | $226,300 | $85,900 | $140,400 |
| 2021 | $3,752 | $226,300 | $85,900 | $140,400 |
| 2020 | $3,380 | $161,800 | $59,500 | $102,300 |
| 2019 | $3,380 | $161,800 | $59,500 | $102,300 |
| 2018 | $3,257 | $161,800 | $59,500 | $102,300 |
| 2017 | $3,090 | $136,000 | $45,200 | $90,800 |
| 2016 | $2,977 | $136,000 | $45,200 | $90,800 |
| 2015 | $2,977 | $136,000 | $45,200 | $90,800 |
| 2014 | $2,899 | $125,700 | $45,200 | $80,500 |
Source: Public Records
Map
Nearby Homes
- 179 Columbine Ave
- 147 Coyle Ave
- 19 Lodi St
- 207 Benefit St
- 27 Aiken St
- 79 Turner St
- 37 Turner St
- 39 Webster St Unit 204
- 50 Stearns St
- 27 Collins Ave
- 39 Chaplin St
- 61 Mendon Rd
- 0 Chaplin St
- 83 Chaplin St
- 48 Pullman Ave
- 180 Darlingdale Ave
- 580 Central Ave
- 211 Carnation St
- 574 Central Ave
- 50 Pullman Ave Unit B