130 Kiltirnan Ct Unit 1 Alpharetta, GA 30004
Estimated Value: $818,000 - $1,047,000
4
Beds
4
Baths
2,962
Sq Ft
$317/Sq Ft
Est. Value
About This Home
This home is located at 130 Kiltirnan Ct Unit 1, Alpharetta, GA 30004 and is currently estimated at $939,545, approximately $317 per square foot. 130 Kiltirnan Ct Unit 1 is a home located in Fulton County with nearby schools including Birmingham Falls Elementary School, Northwestern Middle School, and Milton High School.
Ownership History
Date
Name
Owned For
Owner Type
Purchase Details
Closed on
Apr 18, 2007
Sold by
Warmath John K
Bought by
Warmath John K and Warmath Sylvie K
Current Estimated Value
Purchase Details
Closed on
Apr 30, 1999
Sold by
Morburger Jay T and Morburger Gerilynn P
Bought by
Warmath John K
Home Financials for this Owner
Home Financials are based on the most recent Mortgage that was taken out on this home.
Original Mortgage
$235,000
Interest Rate
6.87%
Mortgage Type
New Conventional
Purchase Details
Closed on
Dec 30, 1994
Sold by
Pinecrest Homes Inc
Bought by
Marburger Jay T Gerilynn
Home Financials for this Owner
Home Financials are based on the most recent Mortgage that was taken out on this home.
Original Mortgage
$203,150
Interest Rate
9.26%
Create a Home Valuation Report for This Property
The Home Valuation Report is an in-depth analysis detailing your home's value as well as a comparison with similar homes in the area
Home Values in the Area
Average Home Value in this Area
Purchase History
| Date | Buyer | Sale Price | Title Company |
|---|---|---|---|
| Warmath John K | -- | -- | |
| Warmath John K | $335,000 | -- | |
| Marburger Jay T Gerilynn | $270,000 | -- |
Source: Public Records
Mortgage History
| Date | Status | Borrower | Loan Amount |
|---|---|---|---|
| Previous Owner | Warmath John K | $235,000 | |
| Previous Owner | Marburger Jay T Gerilynn | $203,150 |
Source: Public Records
Tax History Compared to Growth
Tax History
| Year | Tax Paid | Tax Assessment Tax Assessment Total Assessment is a certain percentage of the fair market value that is determined by local assessors to be the total taxable value of land and additions on the property. | Land | Improvement |
|---|---|---|---|---|
| 2025 | $801 | $246,400 | $81,600 | $164,800 |
| 2023 | $7,216 | $255,640 | $81,600 | $174,040 |
| 2022 | $5,756 | $203,920 | $76,560 | $127,360 |
| 2021 | $5,048 | $180,440 | $61,520 | $118,920 |
| 2020 | $4,376 | $208,840 | $68,240 | $140,600 |
| 2019 | $795 | $205,160 | $67,040 | $138,120 |
| 2018 | $3,927 | $200,360 | $65,480 | $134,880 |
| 2017 | $4,064 | $151,240 | $40,880 | $110,360 |
| 2016 | $4,063 | $151,240 | $40,880 | $110,360 |
| 2015 | $4,724 | $151,240 | $40,880 | $110,360 |
| 2014 | $3,863 | $138,760 | $37,840 | $100,920 |
Source: Public Records
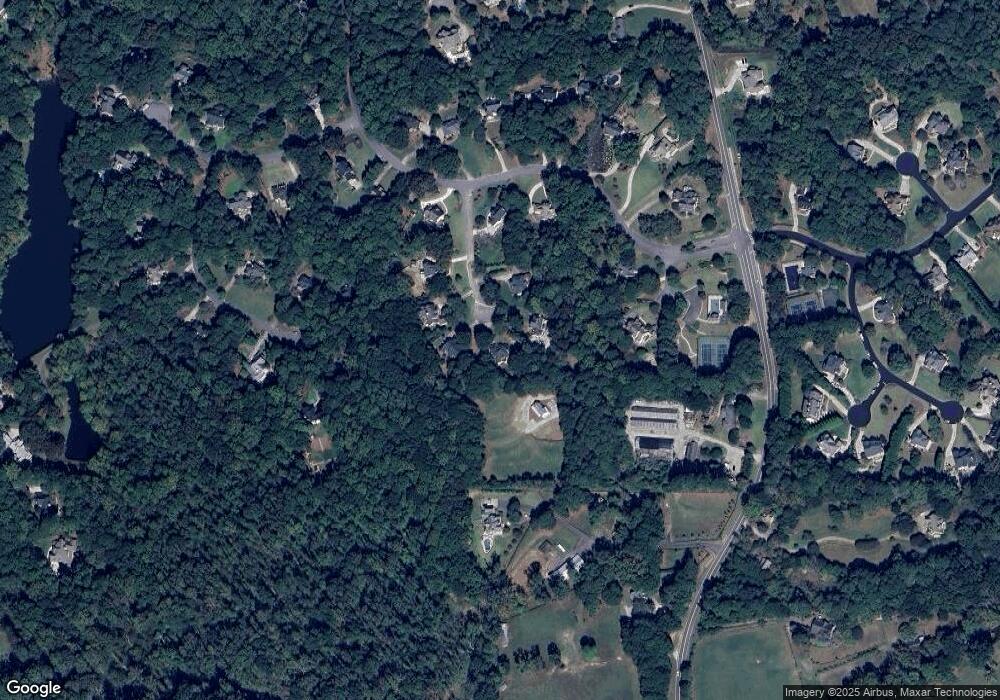
Map
Nearby Homes
- 560 Arcaro Dr
- 363 Gables Walk
- 195 Blackberry Ridge Trail
- 320 Blackberry Ridge Trail
- 14560 Wood Rd
- 393 Taylor Glen Dr
- 170 Golf Link View Unit 6B
- 13980 Haystack Ln
- 345 Lake Bend Ct Unit 1
- 648 Glenover Dr
- 259 Milton Overlook Pass
- 325 Taylor Glen Dr
- 608 Glenover Dr
- 775 Lake Mist Cove
- 14300 Providence Rd
- 560 Lost River Bend
- 1411 Silver Fox Run
- 14260 Phillips Cir
- 13630 Birmingham Hwy
- 1104 Fox Ln
- 120 Kiltirnan Ct
- 14430 Birmingham Hwy
- 135 Kiltirnan Ct Unit 1
- 110 Kiltirnan Ct Unit 1
- 125 Kiltirnan Ct
- 14440 Birmingham Hwy
- 215 Bray Road Ct
- 115 Kiltirnan Ct
- 515 Powers Court Ave
- 535 Powers Court Ave
- 525 Powers Court Ave Unit 1
- 14450 Birmingham Hwy
- 840 Onagh Ct
- 495 Powers Court Ave Unit 1
- 830 Onagh Ct Unit 2
- 14420 Birmingham Hwy
- 485 Powers Court Ave Unit 2
- 895 Onagh Ct
- 820 Onagh Ct
- 0 Powers Court Ave Unit 7232385