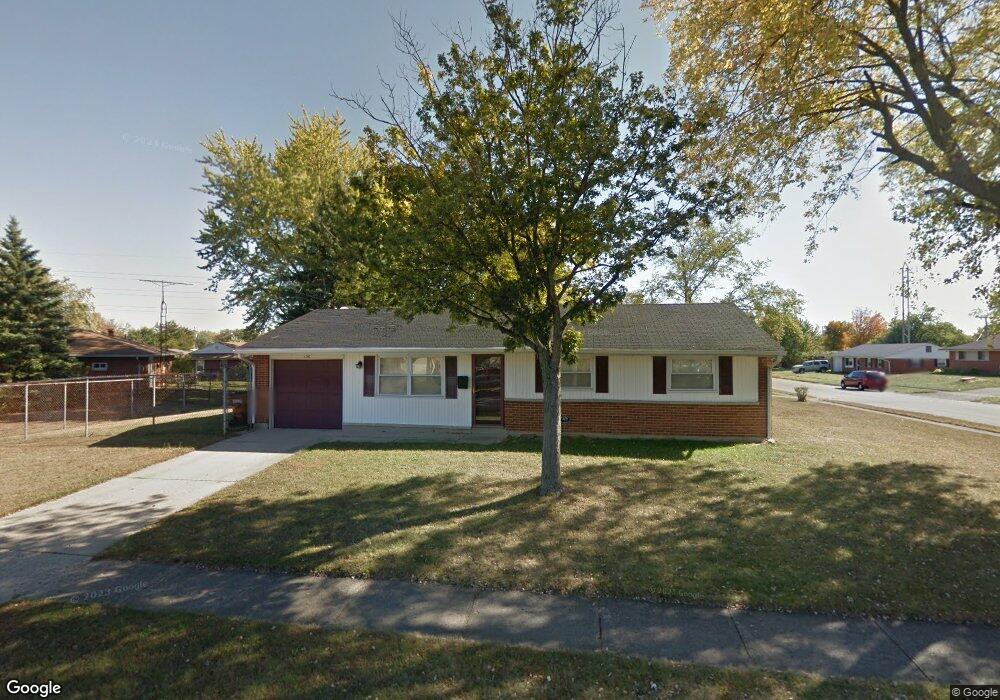
130 Lodestone Dr Englewood, OH 45322
Estimated Value: $163,000 - $175,408
3
Beds
1
Bath
1,014
Sq Ft
$167/Sq Ft
Est. Value
About This Home
This home is located at 130 Lodestone Dr, Englewood, OH 45322 and is currently estimated at $169,602, approximately $167 per square foot. 130 Lodestone Dr is a home located in Montgomery County with nearby schools including Northmont High School, Trotwood Preparatory & Fitness Academy, and Imagine Schools - Woodbury Academy.
Ownership History
Date
Name
Owned For
Owner Type
Purchase Details
Closed on
Dec 17, 2021
Sold by
Merritt Genessa L and Merritt Marvin
Bought by
Zipoy Krystal and Zipoy John
Current Estimated Value
Purchase Details
Closed on
Aug 30, 2004
Sold by
Schaurer Jason M and Schaurer Leslie R
Bought by
Roberts Genessa L
Home Financials for this Owner
Home Financials are based on the most recent Mortgage that was taken out on this home.
Original Mortgage
$89,205
Interest Rate
5.75%
Mortgage Type
Fannie Mae Freddie Mac
Purchase Details
Closed on
Apr 21, 2003
Sold by
Schauerer Jason M and Schauerer Gregory A
Bought by
Schaurer Jason M
Home Financials for this Owner
Home Financials are based on the most recent Mortgage that was taken out on this home.
Original Mortgage
$79,000
Interest Rate
5.86%
Mortgage Type
Balloon
Purchase Details
Closed on
Oct 30, 1997
Sold by
Schaurer Karen R and Gleadell Karen Renee
Bought by
Schaurer Jason M and Schaurer Gregory A
Create a Home Valuation Report for This Property
The Home Valuation Report is an in-depth analysis detailing your home's value as well as a comparison with similar homes in the area
Home Values in the Area
Average Home Value in this Area
Purchase History
| Date | Buyer | Sale Price | Title Company |
|---|---|---|---|
| Zipoy Krystal | $135,000 | Landmark Ttl Agcy South Inc | |
| Roberts Genessa L | $93,900 | None Available | |
| Schaurer Jason M | -- | -- | |
| Schaurer Jason M | $79,300 | -- |
Source: Public Records
Mortgage History
| Date | Status | Borrower | Loan Amount |
|---|---|---|---|
| Previous Owner | Roberts Genessa L | $89,205 | |
| Previous Owner | Schaurer Jason M | $79,000 |
Source: Public Records
Tax History Compared to Growth
Tax History
| Year | Tax Paid | Tax Assessment Tax Assessment Total Assessment is a certain percentage of the fair market value that is determined by local assessors to be the total taxable value of land and additions on the property. | Land | Improvement |
|---|---|---|---|---|
| 2024 | $2,299 | $40,180 | $9,470 | $30,710 |
| 2023 | $2,299 | $40,180 | $9,470 | $30,710 |
| 2022 | $2,102 | $28,260 | $6,670 | $21,590 |
| 2021 | $2,108 | $28,260 | $6,670 | $21,590 |
| 2020 | $2,068 | $28,260 | $6,670 | $21,590 |
| 2019 | $1,932 | $23,640 | $7,670 | $15,970 |
| 2018 | $1,897 | $23,640 | $7,670 | $15,970 |
| 2017 | $1,978 | $23,640 | $7,670 | $15,970 |
| 2016 | $1,930 | $22,620 | $6,670 | $15,950 |
| 2015 | $1,773 | $22,620 | $6,670 | $15,950 |
| 2014 | $1,773 | $22,620 | $6,670 | $15,950 |
| 2012 | -- | $27,320 | $7,350 | $19,970 |
Source: Public Records
Map
Nearby Homes
- 206 Lodestone Dr
- 109 Silverstone Dr
- 104 Silverstone Dr
- 803 Albert St
- 607 Albert St
- 108 Tate Ave
- 800 Sipos Cir
- 510 Rohr Ln
- 208 S Walnut St
- 534 Unger Ave
- 123 Chestnut St
- 510 Lambert Ln
- 717 Woodlawn Ave
- 108 Denwood Trail
- 718 Bonnycastle Ave
- 505 Durst Dr
- 306 Pauly Dr
- 206 Gardengrove Way
- 1010 Heathwood Dr
- 118 Elm Ct
- 402 Brownstone Dr
- 120 Lodestone Dr
- 336 Brownstone Dr
- 404 Brownstone Dr
- 403 Brownstone Dr
- 116 Lodestone Dr
- 127 Lodestone Dr
- 405 Brownstone Dr
- 339 Brownstone Dr
- 125 Lodestone Dr
- 123 Lodestone Dr
- 121 Lodestone Dr
- 114 Lodestone Dr
- 407 Brownstone Dr
- 406 Brownstone Dr
- 330 Brownstone Dr
- 337 Brownstone Dr
- 119 Lodestone Dr
- 326 Brownstone Dr
- 205 Lodestone Dr