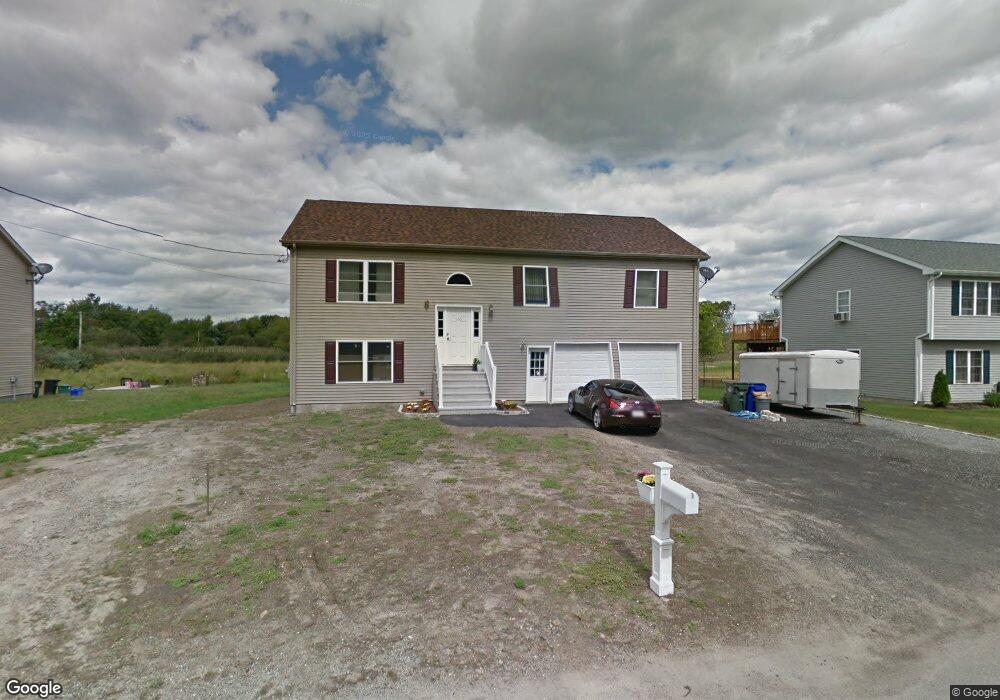
130 Lynwood St Fall River, MA 02721
Maplewood NeighborhoodEstimated Value: $493,253 - $582,000
3
Beds
2
Baths
1,375
Sq Ft
$388/Sq Ft
Est. Value
About This Home
This home is located at 130 Lynwood St, Fall River, MA 02721 and is currently estimated at $533,313, approximately $387 per square foot. 130 Lynwood St is a home located in Bristol County with nearby schools including Henry Lord Community School, B M C Durfee High School, and Argosy Collegiate Charter School.
Ownership History
Date
Name
Owned For
Owner Type
Purchase Details
Closed on
Sep 2, 2011
Sold by
Jmd Land Co Llc
Bought by
Season Realty Llc
Current Estimated Value
Home Financials for this Owner
Home Financials are based on the most recent Mortgage that was taken out on this home.
Original Mortgage
$221,901
Outstanding Balance
$153,831
Interest Rate
4.52%
Mortgage Type
Purchase Money Mortgage
Estimated Equity
$379,482
Create a Home Valuation Report for This Property
The Home Valuation Report is an in-depth analysis detailing your home's value as well as a comparison with similar homes in the area
Home Values in the Area
Average Home Value in this Area
Purchase History
| Date | Buyer | Sale Price | Title Company |
|---|---|---|---|
| Season Realty Llc | -- | -- | |
| Jmd Land Co Llc | -- | -- |
Source: Public Records
Mortgage History
| Date | Status | Borrower | Loan Amount |
|---|---|---|---|
| Open | Jmd Land Co Llc | $221,901 |
Source: Public Records
Tax History Compared to Growth
Tax History
| Year | Tax Paid | Tax Assessment Tax Assessment Total Assessment is a certain percentage of the fair market value that is determined by local assessors to be the total taxable value of land and additions on the property. | Land | Improvement |
|---|---|---|---|---|
| 2025 | $4,658 | $406,800 | $121,000 | $285,800 |
| 2024 | $4,179 | $363,700 | $118,600 | $245,100 |
| 2023 | $4,211 | $343,200 | $106,900 | $236,300 |
| 2022 | $3,709 | $293,900 | $100,800 | $193,100 |
| 2021 | $3,741 | $270,500 | $96,300 | $174,200 |
| 2020 | $3,641 | $252,000 | $91,900 | $160,100 |
| 2019 | $3,728 | $255,700 | $96,100 | $159,600 |
| 2018 | $3,592 | $245,700 | $96,800 | $148,900 |
| 2017 | $3,423 | $244,500 | $96,800 | $147,700 |
| 2016 | $3,278 | $240,500 | $99,800 | $140,700 |
| 2015 | $3,172 | $242,500 | $84,700 | $157,800 |
| 2014 | $2,922 | $232,300 | $74,500 | $157,800 |
Source: Public Records
Map
Nearby Homes
- 24 Bronson St
- 20 Bronson St
- 16 Bronson St
- 4 Bronson St
- 12 Bronson St
- 8 Bronson St
- 17 Lynwood St
- 495 Hooper St
- 153 Fish Rd Unit 4
- 579 Summit St Unit 3
- 579 Summit St Unit 2
- 88 Kenyon Rd
- 81 Kenyon Rd
- 238 Judson St
- 64 Kenyon Rd
- 584-586 Mount Hope Ave
- 126 Wheeler St
- 217 Napoleon St
- 0 Kaufman Rd Unit 73333701
- 0 Kaufman Rd Unit 1384670
- 148 Lynwood St
- 112 Lynwood St
- 108 Lynwood St
- 113 Lynwood St
- 125 Lynwood St
- 101 Lynwood St
- 164 Lynwood St
- 157 Whitefield St
- 145 Whitefield St
- 169 Whitefield St
- 89 Lynwood St
- 86 Lynwood St
- 118 Lynwood St
- 3 Frederick St
- 180 Lynwood St
- 77 Lynwood St
- 181 Whitefield St
- 88 Frederick St
- 65 Lynwood St
- 95 Frederick St