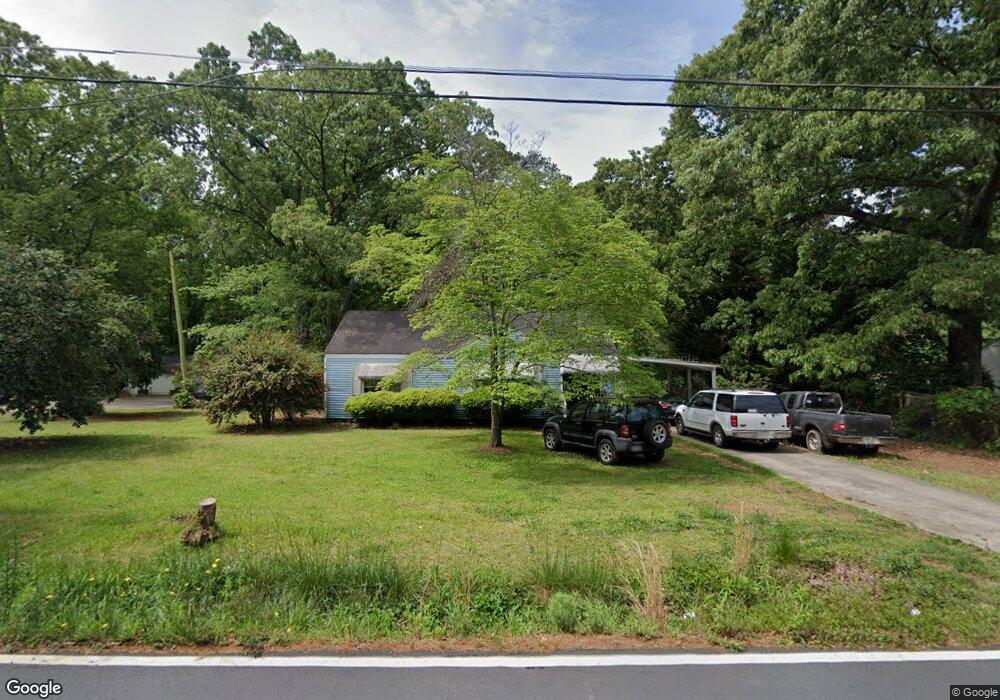
130 Magnolia Dr Griffin, GA 30223
Spalding County NeighborhoodEstimated Value: $111,000 - $144,000
2
Beds
1
Bath
912
Sq Ft
$140/Sq Ft
Est. Value
About This Home
This home is located at 130 Magnolia Dr, Griffin, GA 30223 and is currently estimated at $127,368, approximately $139 per square foot. 130 Magnolia Dr is a home located in Spalding County with nearby schools including Cowan Road Elementary School, Cowan Road Middle School, and Griffin High School.
Ownership History
Date
Name
Owned For
Owner Type
Purchase Details
Closed on
Feb 25, 2022
Sold by
Hallmark Perry R
Bought by
Ve Properties Llc
Current Estimated Value
Purchase Details
Closed on
May 30, 2013
Sold by
Hallmark Elizabeth Dale
Bought by
Hallmark Perry R and Hallmark Tammy L
Home Financials for this Owner
Home Financials are based on the most recent Mortgage that was taken out on this home.
Original Mortgage
$22,400
Interest Rate
3.37%
Mortgage Type
New Conventional
Purchase Details
Closed on
Feb 19, 1990
Sold by
Hallmark Pete Ronald Etal
Bought by
Wilder Odessa Royals
Purchase Details
Closed on
Feb 15, 1989
Sold by
Crawley Katie Odessa Royals Aka Wilder
Bought by
Hallmark Pete Ronald Etal
Purchase Details
Closed on
Oct 4, 1978
Sold by
Dykes Belton and Dykes Mary W
Bought by
Crawley Katie Odessa Royals Aka Wil
Purchase Details
Closed on
Oct 11, 1976
Sold by
Tingle Sam P
Bought by
Dykes Belton and Dykes Mary W
Create a Home Valuation Report for This Property
The Home Valuation Report is an in-depth analysis detailing your home's value as well as a comparison with similar homes in the area
Home Values in the Area
Average Home Value in this Area
Purchase History
| Date | Buyer | Sale Price | Title Company |
|---|---|---|---|
| Ve Properties Llc | $85,000 | -- | |
| Hallmark Perry R | $28,000 | -- | |
| Wilder Odessa Royals | -- | -- | |
| Hallmark Pete Ronald Etal | -- | -- | |
| Crawley Katie Odessa Royals Aka Wil | $8,800 | -- | |
| Dykes Belton | $24,000 | -- |
Source: Public Records
Mortgage History
| Date | Status | Borrower | Loan Amount |
|---|---|---|---|
| Previous Owner | Hallmark Perry R | $22,400 |
Source: Public Records
Tax History Compared to Growth
Tax History
| Year | Tax Paid | Tax Assessment Tax Assessment Total Assessment is a certain percentage of the fair market value that is determined by local assessors to be the total taxable value of land and additions on the property. | Land | Improvement |
|---|---|---|---|---|
| 2024 | $1,197 | $33,426 | $8,800 | $24,626 |
| 2023 | $1,215 | $33,426 | $8,800 | $24,626 |
| 2022 | $871 | $23,942 | $8,000 | $15,942 |
| 2021 | $665 | $18,286 | $4,000 | $14,286 |
| 2020 | $667 | $18,286 | $4,000 | $14,286 |
| 2019 | $681 | $18,286 | $4,000 | $14,286 |
| 2018 | $659 | $17,251 | $4,000 | $13,251 |
| 2017 | $598 | $16,092 | $4,000 | $12,092 |
| 2016 | $609 | $16,092 | $4,000 | $12,092 |
| 2015 | $627 | $16,092 | $4,000 | $12,092 |
| 2014 | $445 | $16,092 | $4,000 | $12,092 |
Source: Public Records
Map
Nearby Homes
- 1205 Chardonnay Ln
- 1414 Lucky St
- 1807 Ridge St
- 1527 Ridgewood Dr
- 304 Kilgore Rd
- 205 Westmoreland Dr
- 202 Park St
- 2407 Old Atlanta Rd
- 9 E Mcintosh Rd
- 1429 Beatty St
- 1464 Beatty St
- 10 E Mcintosh Rd
- 1643 Hallmark Hills Dr
- 310 Sunset Dr
- 4038 W Mcintosh Rd
- 1611 Hallmark Hills Dr
- 111 Vineyard Rd
- 441 Hickory Ln
- 103 Claire Ct
- 208 Tyler Trace
- 130 Magnolia Dr
- 132 Magnolia Dr
- 128 1/2 Magnolia Dr
- 128 Magnolia Dr
- 127 Magnolia Dr
- 125 Magnolia Dr
- 125 Magnolia Dr
- 202 Magnolia Dr
- 129 Magnolia Dr
- 129 Magnolia Dr
- 126 Magnolia Dr
- 203 Magnolia Dr
- 204 Magnolia Dr
- 124 Magnolia Dr
- 121 Magnolia Dr
- 121 Magnolia Dr
- 205 Magnolia Dr
- 120 Magnolia Dr
- 119 Magnolia Dr
- 118 Magnolia Dr