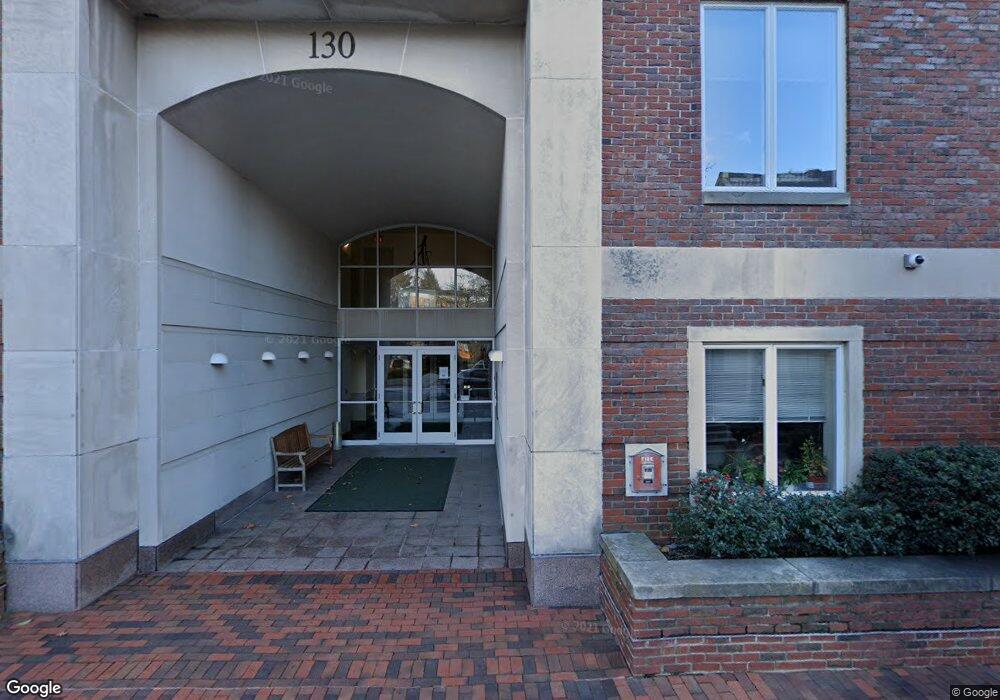
University Green 130 Mt Auburn St Unit 214 Cambridge, MA 02138
West Cambridge NeighborhoodEstimated Value: $1,489,948 - $1,874,000
1
Bed
2
Baths
1,033
Sq Ft
$1,606/Sq Ft
Est. Value
About This Home
This home is located at 130 Mt Auburn St Unit 214, Cambridge, MA 02138 and is currently estimated at $1,659,487, approximately $1,606 per square foot. 130 Mt Auburn St Unit 214 is a home located in Middlesex County with nearby schools including St Peter School, Buckingham Browne & Nichols School, and Saint Paul's Choir School.
Ownership History
Date
Name
Owned For
Owner Type
Purchase Details
Closed on
Sep 16, 2021
Sold by
Garfield Janet F
Bought by
Janet F Garfield T
Current Estimated Value
Purchase Details
Closed on
Apr 13, 2001
Sold by
University Green Nt and Mitchell-Voisin Stella
Bought by
Garfield Janet F
Purchase Details
Closed on
Jul 24, 1996
Sold by
Stanton Peter and Stanton Judith
Bought by
Unit 214 University Nt and Dimond Francis
Purchase Details
Closed on
Mar 25, 1996
Sold by
Wang James C and Wang Sophia S
Bought by
Stanton Peter S and Stanton Judith C
Home Financials for this Owner
Home Financials are based on the most recent Mortgage that was taken out on this home.
Original Mortgage
$330,000
Interest Rate
6.99%
Mortgage Type
Purchase Money Mortgage
Purchase Details
Closed on
Jun 22, 1989
Sold by
Wade Roger W
Bought by
Wang James C
Purchase Details
Closed on
Aug 18, 1987
Sold by
Watson Edward J
Bought by
Wade Roger W
Create a Home Valuation Report for This Property
The Home Valuation Report is an in-depth analysis detailing your home's value as well as a comparison with similar homes in the area
Home Values in the Area
Average Home Value in this Area
Purchase History
| Date | Buyer | Sale Price | Title Company |
|---|---|---|---|
| Janet F Garfield T | -- | None Available | |
| Garfield Janet F | $685,000 | -- | |
| Unit 214 University Nt | $410,000 | -- | |
| Stanton Peter S | $440,000 | -- | |
| Wang James C | $345,000 | -- | |
| Wade Roger W | $300,000 | -- |
Source: Public Records
Mortgage History
| Date | Status | Borrower | Loan Amount |
|---|---|---|---|
| Previous Owner | Wade Roger W | $330,000 | |
| Previous Owner | Wade Roger W | $40,000 | |
| Previous Owner | Wade Roger W | $40,000 |
Source: Public Records
Tax History Compared to Growth
Tax History
| Year | Tax Paid | Tax Assessment Tax Assessment Total Assessment is a certain percentage of the fair market value that is determined by local assessors to be the total taxable value of land and additions on the property. | Land | Improvement |
|---|---|---|---|---|
| 2025 | $9,272 | $1,460,200 | $0 | $1,460,200 |
| 2024 | $8,493 | $1,434,600 | $0 | $1,434,600 |
| 2023 | $8,151 | $1,390,900 | $0 | $1,390,900 |
| 2022 | $8,162 | $1,378,700 | $0 | $1,378,700 |
| 2021 | $8,051 | $1,376,300 | $0 | $1,376,300 |
| 2020 | $7,875 | $1,369,600 | $0 | $1,369,600 |
| 2019 | $7,571 | $1,274,500 | $0 | $1,274,500 |
| 2018 | $7,398 | $1,176,200 | $0 | $1,176,200 |
| 2017 | $7,173 | $1,105,200 | $0 | $1,105,200 |
| 2016 | $7,054 | $1,009,200 | $0 | $1,009,200 |
| 2015 | $7,001 | $895,300 | $0 | $895,300 |
| 2014 | $6,938 | $827,900 | $0 | $827,900 |
Source: Public Records
About University Green
Map
Nearby Homes
- 130 Mount Auburn St Unit 108
- 986 Memorial Dr Unit 404
- 983 Memorial Dr Unit 502
- 984 Memorial Dr Unit 984-503
- 5 Brewer St Unit 5
- 988 Memorial Dr Unit 386
- 975 Memorial Dr Unit 209
- 975 Memorial Dr Unit 211
- 32 Hawthorn St
- 12 Berkeley St
- 3 Berkeley Place
- 50 Follen St Unit 505
- 50 Follen St Unit 109
- 22 Concord Ave Unit 10
- 20 Maynard Place
- 1010 Memorial Dr Unit 6G
- 14 Chauncy St Unit 4
- 44 Garden St
- 15 Hubbard Park Rd
- 1600 Massachusetts Ave Unit 404
- 130 Mt Auburn St Unit 113
- 130 Mount Auburn St Unit 305
- 130 Mount Auburn St Unit 510
- 130 Mount Auburn St Unit 509
- 130 Mount Auburn St Unit 508
- 130 Mount Auburn St Unit 412
- 130 Mount Auburn St Unit 411
- 130 Mount Auburn St Unit 410
- 130 Mount Auburn St Unit 409
- 130 Mount Auburn St Unit 406
- 130 Mount Auburn St Unit 405
- 130 Mount Auburn St Unit 403
- 130 Mount Auburn St Unit 401
- 130 Mount Auburn St Unit 314
- 130 Mount Auburn St Unit 313
- 130 Mount Auburn St Unit 312
- 130 Mount Auburn St Unit 309
- 130 Mount Auburn St Unit 308
- 130 Mount Auburn St Unit 307
- 130 Mount Auburn St Unit 306