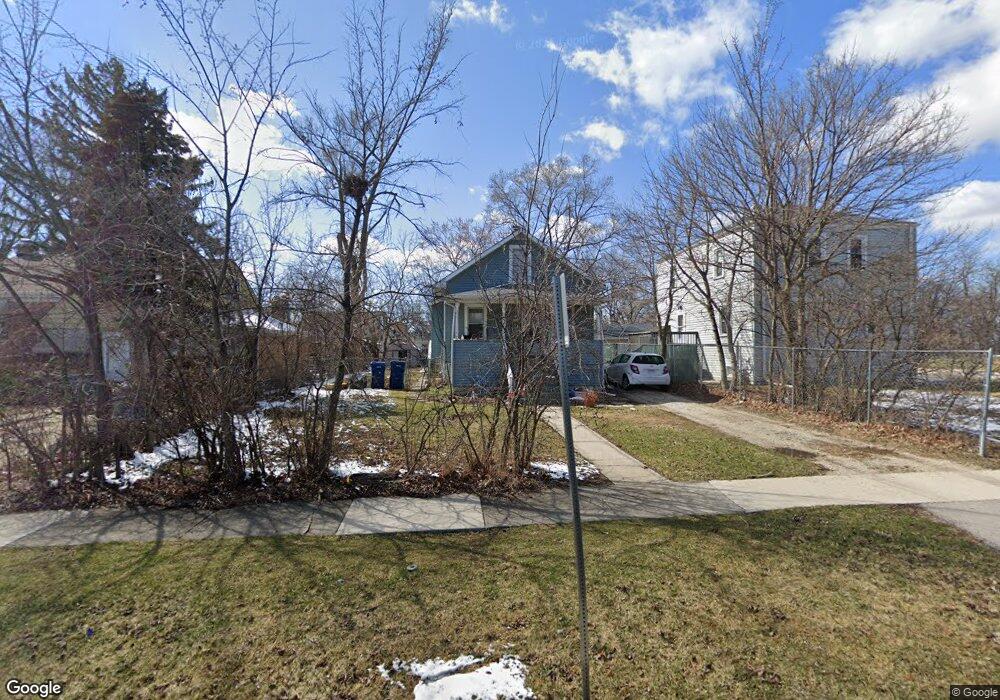
130 N 3rd Ave Villa Park, IL 60181
Estimated Value: $236,791 - $315,000
Studio
--
Bath
894
Sq Ft
$307/Sq Ft
Est. Value
About This Home
This home is located at 130 N 3rd Ave, Villa Park, IL 60181 and is currently estimated at $274,698, approximately $307 per square foot. 130 N 3rd Ave is a home located in DuPage County with nearby schools including Schafer Elementary School, Jefferson Middle School, and Willowbrook High School.
Ownership History
Date
Name
Owned For
Owner Type
Purchase Details
Closed on
Dec 16, 2010
Sold by
Clark Lisa M and Clark Keith A
Bought by
Clark Keith A
Current Estimated Value
Home Financials for this Owner
Home Financials are based on the most recent Mortgage that was taken out on this home.
Original Mortgage
$138,821
Outstanding Balance
$3,162
Interest Rate
4.5%
Mortgage Type
VA
Estimated Equity
$271,536
Purchase Details
Closed on
Feb 23, 2000
Sold by
Jaros John and Jaros Sarah
Bought by
Clark Keith A and Clark Lisa M
Home Financials for this Owner
Home Financials are based on the most recent Mortgage that was taken out on this home.
Original Mortgage
$108,000
Interest Rate
8.21%
Purchase Details
Closed on
Apr 16, 1999
Sold by
Wagner Richard E and Wagner Florence A
Bought by
Jaros John and Jaros Sarah
Home Financials for this Owner
Home Financials are based on the most recent Mortgage that was taken out on this home.
Original Mortgage
$114,952
Interest Rate
7.04%
Mortgage Type
FHA
Create a Home Valuation Report for This Property
The Home Valuation Report is an in-depth analysis detailing your home's value as well as a comparison with similar homes in the area
Home Values in the Area
Average Home Value in this Area
Purchase History
| Date | Buyer | Sale Price | Title Company |
|---|---|---|---|
| Clark Keith A | -- | Git | |
| Clark Keith A | $120,000 | -- | |
| Jaros John | $116,000 | -- |
Source: Public Records
Mortgage History
| Date | Status | Borrower | Loan Amount |
|---|---|---|---|
| Open | Clark Keith A | $138,821 | |
| Closed | Clark Keith A | $108,000 | |
| Previous Owner | Jaros John | $114,952 |
Source: Public Records
Tax History
| Year | Tax Paid | Tax Assessment Tax Assessment Total Assessment is a certain percentage of the fair market value that is determined by local assessors to be the total taxable value of land and additions on the property. | Land | Improvement |
|---|---|---|---|---|
| 2024 | $5,026 | $74,498 | $10,457 | $64,041 |
| 2023 | $4,768 | $68,890 | $9,670 | $59,220 |
| 2022 | $4,683 | $66,230 | $9,300 | $56,930 |
| 2021 | $4,488 | $64,580 | $9,070 | $55,510 |
| 2020 | $4,377 | $63,160 | $8,870 | $54,290 |
| 2019 | $4,078 | $60,050 | $8,430 | $51,620 |
| 2018 | $3,866 | $54,130 | $7,600 | $46,530 |
| 2017 | $3,763 | $51,580 | $7,240 | $44,340 |
| 2016 | $3,644 | $48,590 | $6,820 | $41,770 |
| 2015 | $3,576 | $45,260 | $6,350 | $38,910 |
| 2014 | $3,509 | $44,670 | $10,500 | $34,170 |
| 2013 | $3,347 | $45,300 | $10,650 | $34,650 |
Source: Public Records
Map
Nearby Homes
- 417 W Terrace St
- 935 E Saint Charles Rd
- 912 E Saint Charles Rd
- 20 N Highland Ave
- 736 E Saint Charles Rd
- 360 N Lincoln Ave
- 714 W Pleasant St
- 327 N Princeton Ave Unit 9
- 235 N Ardmore Ave
- 600 N Iowa Ave
- 526 N Harvard Ave
- 208 S Highland Ave
- 706 W James St
- 58 E Division St
- 108 S Cornell Ave
- 402 S Michigan Ave
- 528 N Ardmore Ave
- 500 E Saint Charles Rd Unit 209
- 551 N Vista Ave
- 647 N Kramer Ave
Your Personal Tour Guide
Ask me questions while you tour the home.