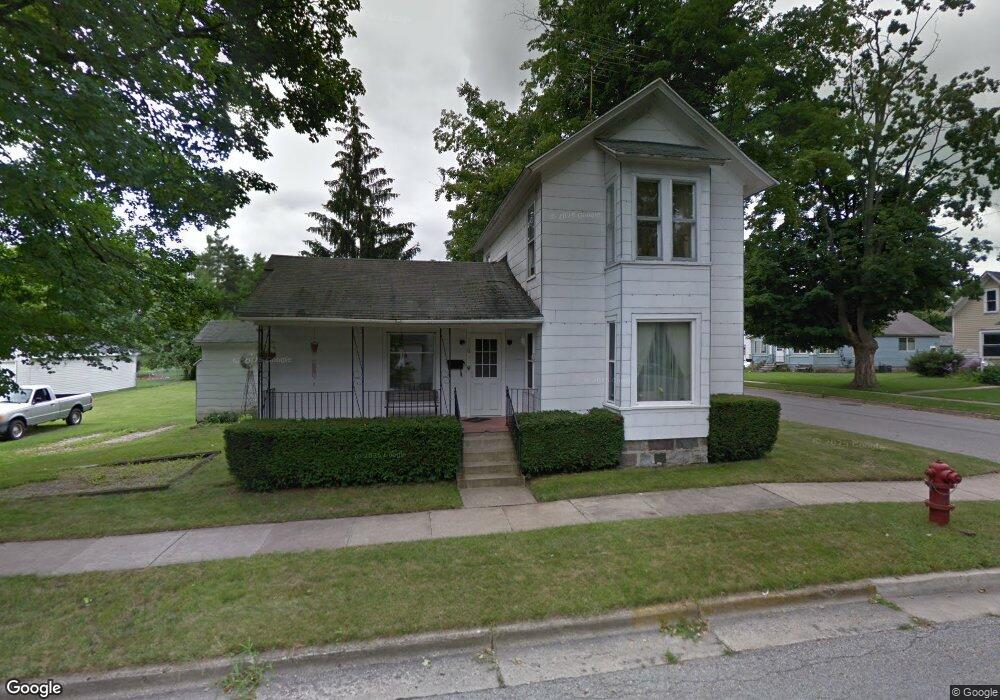
130 Nash St Unit ELM Sparta, MI 49345
Estimated Value: $220,549 - $262,000
3
Beds
1
Bath
1,189
Sq Ft
$203/Sq Ft
Est. Value
About This Home
This home is located at 130 Nash St Unit ELM, Sparta, MI 49345 and is currently estimated at $241,387, approximately $203 per square foot. 130 Nash St Unit ELM is a home located in Kent County with nearby schools including Ridgeview Elementary School, Appleview Elementary School, and Sparta Middle School.
Ownership History
Date
Name
Owned For
Owner Type
Purchase Details
Closed on
Nov 8, 2013
Sold by
Pa Development Llc
Bought by
Hawley Dawn A
Current Estimated Value
Home Financials for this Owner
Home Financials are based on the most recent Mortgage that was taken out on this home.
Original Mortgage
$74,489
Outstanding Balance
$55,572
Interest Rate
4.24%
Mortgage Type
New Conventional
Estimated Equity
$185,815
Purchase Details
Closed on
Feb 13, 2013
Sold by
Hieftje Melinda Kay
Bought by
Pa Development Llc
Purchase Details
Closed on
Aug 1, 2012
Sold by
Hieftje Melinda
Bought by
Pa Development Llc
Purchase Details
Closed on
Jul 2, 1999
Sold by
Hull Michael and Hull Nicole
Bought by
Hieftje Melinda and Hawley Dawn A
Purchase Details
Closed on
Mar 29, 1996
Sold by
Miller Jerry and Mari Jo
Bought by
Hull Michael and Hull Nicole
Create a Home Valuation Report for This Property
The Home Valuation Report is an in-depth analysis detailing your home's value as well as a comparison with similar homes in the area
Home Values in the Area
Average Home Value in this Area
Purchase History
| Date | Buyer | Sale Price | Title Company |
|---|---|---|---|
| Hawley Dawn A | $79,000 | None Available | |
| Pa Development Llc | $36,301 | None Available | |
| Pa Development Llc | $17,100 | None Available | |
| Hieftje Melinda | $83,000 | -- | |
| Hull Michael | $59,000 | -- |
Source: Public Records
Mortgage History
| Date | Status | Borrower | Loan Amount |
|---|---|---|---|
| Open | Hawley Dawn A | $74,489 |
Source: Public Records
Tax History Compared to Growth
Tax History
| Year | Tax Paid | Tax Assessment Tax Assessment Total Assessment is a certain percentage of the fair market value that is determined by local assessors to be the total taxable value of land and additions on the property. | Land | Improvement |
|---|---|---|---|---|
| 2025 | $1,422 | $86,100 | $0 | $0 |
| 2024 | $1,422 | $80,100 | $0 | $0 |
| 2023 | $1,357 | $71,600 | $0 | $0 |
| 2022 | $1,556 | $55,900 | $0 | $0 |
| 2021 | $1,512 | $52,400 | $0 | $0 |
| 2020 | $1,216 | $50,100 | $0 | $0 |
| 2019 | $1,026 | $46,900 | $0 | $0 |
| 2018 | $1,442 | $39,200 | $0 | $0 |
| 2017 | $2,220 | $35,500 | $0 | $0 |
| 2016 | $1,363 | $34,000 | $0 | $0 |
| 2015 | -- | $34,000 | $0 | $0 |
| 2013 | -- | $25,800 | $0 | $0 |
Source: Public Records
Map
Nearby Homes
- 94 W Division St
- 238 W Division St
- 243 W Gardner St
- 239 W Gardner St
- 92 N State St
- 137 Ida Red Ave
- 120 S Union St
- 270 Creekside St
- 187 Centennial St
- 69 Grove St
- 9340-2A Sparta Ave NW
- 91 Prospect St NW
- 203 Martindale St NW
- 211 Martindale St NW
- 522 Leisure Acres St
- 515 Hill Valley Ln
- 320 Taylor Place
- 523 Hill Valley Ln
- 516 Hill Valley Ln
- London Plan at Country Meadows