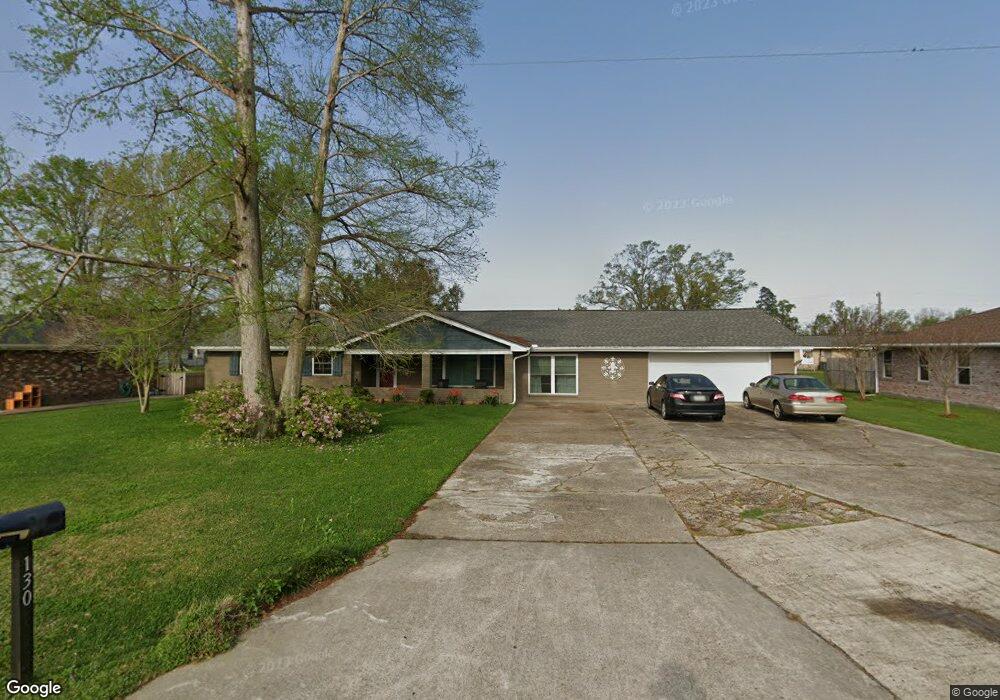
130 Oak Ln Luling, LA 70070
Estimated Value: $309,000 - $329,000
4
Beds
2
Baths
2,240
Sq Ft
$143/Sq Ft
Est. Value
About This Home
This home is located at 130 Oak Ln, Luling, LA 70070 and is currently estimated at $321,080, approximately $143 per square foot. 130 Oak Ln is a home located in St. Charles Parish with nearby schools including Mimosa Park Elementary School, Lakewood Elementary School, and J.B. Martin Middle School.
Ownership History
Date
Name
Owned For
Owner Type
Purchase Details
Closed on
Nov 19, 2021
Sold by
Smith Lawrence Mark and Smith Lauretta Marie
Bought by
Downs Ethan Robert and Downs Katherine Hymel
Current Estimated Value
Home Financials for this Owner
Home Financials are based on the most recent Mortgage that was taken out on this home.
Original Mortgage
$304,000
Outstanding Balance
$276,211
Interest Rate
2.99%
Mortgage Type
New Conventional
Estimated Equity
$44,869
Purchase Details
Closed on
May 24, 2005
Sold by
Deroche Mary Bourgeois and Deroche Mary E Bourgeois
Bought by
Smith Lawrence Mark
Home Financials for this Owner
Home Financials are based on the most recent Mortgage that was taken out on this home.
Original Mortgage
$146,700
Interest Rate
5.37%
Mortgage Type
Adjustable Rate Mortgage/ARM
Create a Home Valuation Report for This Property
The Home Valuation Report is an in-depth analysis detailing your home's value as well as a comparison with similar homes in the area
Home Values in the Area
Average Home Value in this Area
Purchase History
| Date | Buyer | Sale Price | Title Company |
|---|---|---|---|
| Downs Ethan Robert | $320,000 | None Available | |
| Smith Lawrence Mark | $163,000 | None Available |
Source: Public Records
Mortgage History
| Date | Status | Borrower | Loan Amount |
|---|---|---|---|
| Open | Downs Ethan Robert | $304,000 | |
| Previous Owner | Smith Lawrence Mark | $146,700 |
Source: Public Records
Tax History
| Year | Tax Paid | Tax Assessment Tax Assessment Total Assessment is a certain percentage of the fair market value that is determined by local assessors to be the total taxable value of land and additions on the property. | Land | Improvement |
|---|---|---|---|---|
| 2025 | $1,999 | $27,280 | $7,760 | $19,520 |
| 2024 | $1,999 | $27,280 | $7,760 | $19,520 |
| 2023 | $2,030 | $22,616 | $4,990 | $17,626 |
| 2022 | $2,645 | $22,616 | $4,990 | $17,626 |
| 2021 | $2,033 | $17,235 | $4,491 | $12,744 |
| 2020 | $2,263 | $19,150 | $4,990 | $14,160 |
| 2019 | $1,949 | $16,440 | $3,000 | $13,440 |
| 2018 | $1,934 | $16,440 | $3,000 | $13,440 |
| 2017 | $1,932 | $16,440 | $3,000 | $13,440 |
| 2016 | $1,940 | $16,440 | $3,000 | $13,440 |
| 2015 | $1,035 | $16,300 | $3,561 | $12,739 |
| 2014 | $997 | $16,300 | $3,561 | $12,739 |
| 2013 | $1,000 | $16,300 | $3,561 | $12,739 |
Source: Public Records
Map
Nearby Homes
Your Personal Tour Guide
Ask me questions while you tour the home.