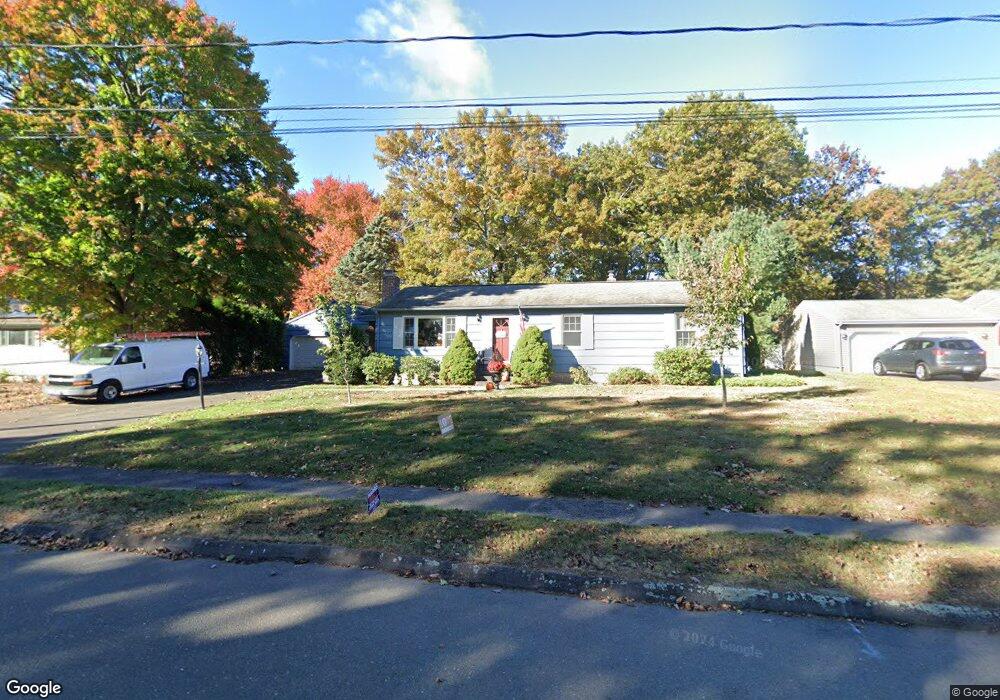
130 Pheasant Run Rd Southington, CT 06489
West Southington NeighborhoodEstimated Value: $433,000 - $448,000
3
Beds
2
Baths
1,176
Sq Ft
$372/Sq Ft
Est. Value
About This Home
This home is located at 130 Pheasant Run Rd, Southington, CT 06489 and is currently estimated at $437,376, approximately $371 per square foot. 130 Pheasant Run Rd is a home located in Hartford County with nearby schools including Urbin T. Kelley Elementary School, John F. Kennedy Middle School, and Southington High School.
Ownership History
Date
Name
Owned For
Owner Type
Purchase Details
Closed on
Jan 3, 2024
Sold by
Chagnon James C Est and Chagnon
Bought by
Chagnon Gregory
Current Estimated Value
Home Financials for this Owner
Home Financials are based on the most recent Mortgage that was taken out on this home.
Original Mortgage
$288,750
Outstanding Balance
$284,013
Interest Rate
7.29%
Mortgage Type
Purchase Money Mortgage
Estimated Equity
$153,363
Purchase Details
Closed on
May 27, 1987
Sold by
Barry Russell
Bought by
Chagnon James
Home Financials for this Owner
Home Financials are based on the most recent Mortgage that was taken out on this home.
Original Mortgage
$105,000
Interest Rate
10.25%
Mortgage Type
Purchase Money Mortgage
Create a Home Valuation Report for This Property
The Home Valuation Report is an in-depth analysis detailing your home's value as well as a comparison with similar homes in the area
Home Values in the Area
Average Home Value in this Area
Purchase History
| Date | Buyer | Sale Price | Title Company |
|---|---|---|---|
| Chagnon Gregory | $385,000 | None Available | |
| Chagnon James | $172,000 | -- |
Source: Public Records
Mortgage History
| Date | Status | Borrower | Loan Amount |
|---|---|---|---|
| Open | Chagnon Gregory | $288,750 | |
| Previous Owner | Chagnon James | $177,600 | |
| Previous Owner | Chagnon James | $105,000 |
Source: Public Records
Tax History
| Year | Tax Paid | Tax Assessment Tax Assessment Total Assessment is a certain percentage of the fair market value that is determined by local assessors to be the total taxable value of land and additions on the property. | Land | Improvement |
|---|---|---|---|---|
| 2025 | $5,283 | $159,070 | $61,870 | $97,200 |
| 2024 | $5,001 | $159,070 | $61,870 | $97,200 |
| 2023 | $4,829 | $159,070 | $61,870 | $97,200 |
| 2022 | $4,634 | $159,070 | $61,870 | $97,200 |
| 2021 | $4,618 | $159,070 | $61,870 | $97,200 |
| 2020 | $4,360 | $142,340 | $63,130 | $79,210 |
| 2019 | $4,361 | $142,340 | $63,130 | $79,210 |
| 2018 | $4,339 | $142,340 | $63,130 | $79,210 |
| 2017 | $4,339 | $142,340 | $63,130 | $79,210 |
| 2016 | $4,219 | $142,340 | $63,130 | $79,210 |
| 2015 | $4,067 | $139,560 | $56,950 | $82,610 |
| 2014 | $3,958 | $139,560 | $56,950 | $82,610 |
Source: Public Records
Map
Nearby Homes
- 484 Jude Ln
- 53 Alder Ln
- 1275 Mount Vernon Rd
- 132 Walkley Dr
- 154 Cascade Ridge
- 31 Edgewood Cir
- 943 Mount Vernon Rd
- 477 Churchill St
- 88 October Ln
- 46 John St
- 317 West St
- 20 John St
- 0 Winchester Estates Lot 17
- 9 Preli Ct
- 151 Diana Rd
- 28 Beecher St
- 1384 West St
- 457 Curtiss St
- 82 Summer St Unit A
- 82 Summer St Unit B
- 120 Pheasant Run Rd
- 140 Pheasant Run Rd
- 20 Yorktown Rd
- 110 Pheasant Run Rd
- 30 Yorktown Rd
- 10 Yorktown Rd
- 131 Pheasant Run Rd
- 121 Pheasant Run Rd
- 141 Pheasant Run Rd
- 100 Pheasant Run Rd
- 40 Yorktown Rd
- 111 Pheasant Run Rd
- 52 Foxcroft Ct
- 8 Yorktown Rd
- 35 Stacy Cate Dr
- 99 Pheasant Run Rd
- 90 Pheasant Run Rd
- 25 Yorktown Rd
- 15 Yorktown Rd
- 160 Autumn Dr
Your Personal Tour Guide
Ask me questions while you tour the home.