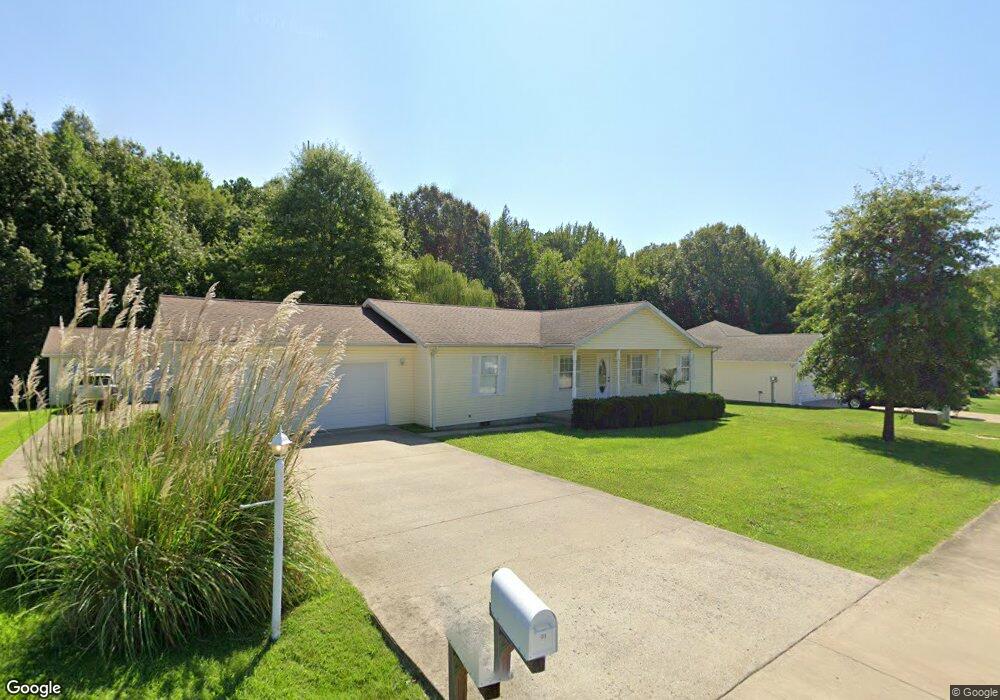
130 Pin Oak Ln Harrisburg, IL 62946
Estimated Value: $183,327 - $221,000
--
Bed
--
Bath
--
Sq Ft
--
Built
About This Home
This home is located at 130 Pin Oak Ln, Harrisburg, IL 62946 and is currently estimated at $204,082. 130 Pin Oak Ln is a home located in Saline County with nearby schools including East Side Intermediate School, Harrisburg Middle School, and Harrisburg High School.
Ownership History
Date
Name
Owned For
Owner Type
Purchase Details
Closed on
Oct 14, 2005
Sold by
Simpson John Mark
Bought by
Harris Fred
Current Estimated Value
Home Financials for this Owner
Home Financials are based on the most recent Mortgage that was taken out on this home.
Original Mortgage
$89,000
Interest Rate
7.25%
Mortgage Type
Adjustable Rate Mortgage/ARM
Purchase Details
Closed on
Apr 1, 2005
Sold by
Heartland Land Development Inc
Bought by
Simpson John Mark
Home Financials for this Owner
Home Financials are based on the most recent Mortgage that was taken out on this home.
Original Mortgage
$80,000
Interest Rate
5.88%
Mortgage Type
Construction
Create a Home Valuation Report for This Property
The Home Valuation Report is an in-depth analysis detailing your home's value as well as a comparison with similar homes in the area
Home Values in the Area
Average Home Value in this Area
Purchase History
| Date | Buyer | Sale Price | Title Company |
|---|---|---|---|
| Harris Fred | -- | None Available | |
| Simpson John Mark | -- | None Available |
Source: Public Records
Mortgage History
| Date | Status | Borrower | Loan Amount |
|---|---|---|---|
| Closed | Harris Fred | $89,000 | |
| Previous Owner | Simpson John Mark | $80,000 |
Source: Public Records
Tax History Compared to Growth
Tax History
| Year | Tax Paid | Tax Assessment Tax Assessment Total Assessment is a certain percentage of the fair market value that is determined by local assessors to be the total taxable value of land and additions on the property. | Land | Improvement |
|---|---|---|---|---|
| 2024 | $4,209 | $58,021 | $6,157 | $51,864 |
| 2023 | $3,771 | $49,179 | $5,219 | $43,960 |
| 2022 | $4,170 | $46,360 | $4,920 | $41,440 |
| 2021 | $4,334 | $47,792 | $5,072 | $42,720 |
| 2020 | $4,266 | $46,360 | $4,920 | $41,440 |
| 2019 | $4,346 | $46,360 | $4,920 | $41,440 |
| 2018 | $4,393 | $46,360 | $4,920 | $41,440 |
| 2017 | $4,326 | $46,360 | $4,920 | $41,440 |
| 2016 | $43 | $46,360 | $4,920 | $41,440 |
| 2015 | -- | $46,360 | $4,920 | $41,440 |
| 2014 | $3,614 | $46,360 | $4,920 | $41,440 |
| 2013 | $3,614 | $46,360 | $4,920 | $41,440 |
| 2012 | $3,614 | $47,175 | $5,735 | $41,440 |
Source: Public Records
Map
Nearby Homes
- 1116 S Holland St
- 405 S Shaw St
- 614 W College St
- 827 W Raymond St
- 1006 S Land St
- 1116 S Land St
- 205 S Shaw St
- 615 Liberty Rd
- 1101 S Mckinley St
- 500 W Sloan St
- 734 S Mckinley St
- 1523 S Mckinley St
- 618 S Mckinley St
- 520 S Mckinley St
- 517 W Barnett St
- 0000 S Commercial St
- 885 Liberty Rd
- 504 W South St
- 1111 S Roosevelt St
- 201 W Ogara St