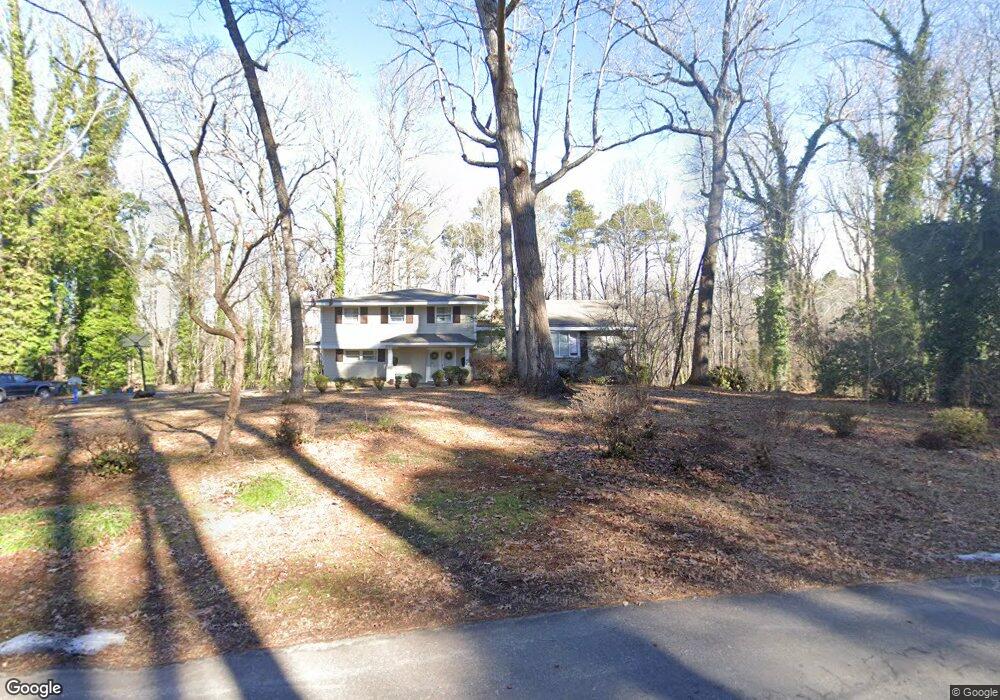
130 Pine Cone Dr Oxford, NC 27565
Estimated Value: $443,298 - $519,000
4
Beds
4
Baths
3,113
Sq Ft
$150/Sq Ft
Est. Value
About This Home
This home is located at 130 Pine Cone Dr, Oxford, NC 27565 and is currently estimated at $465,825, approximately $149 per square foot. 130 Pine Cone Dr is a home located in Granville County with nearby schools including Stovall-Shaw Elementary School, Northern Granville Middle School, and Hill City High School.
Ownership History
Date
Name
Owned For
Owner Type
Purchase Details
Closed on
Mar 19, 2014
Sold by
Redwine Nash E and Redwine Jessica
Bought by
Koinis Gerald T and Koinis Doranna F
Current Estimated Value
Home Financials for this Owner
Home Financials are based on the most recent Mortgage that was taken out on this home.
Original Mortgage
$209,000
Outstanding Balance
$157,811
Interest Rate
4.24%
Mortgage Type
New Conventional
Estimated Equity
$308,014
Purchase Details
Closed on
Nov 29, 2005
Sold by
Moutos Fredrick Chris
Bought by
Redwine Nash E and Redwine Jessica
Home Financials for this Owner
Home Financials are based on the most recent Mortgage that was taken out on this home.
Original Mortgage
$169,400
Interest Rate
5.62%
Mortgage Type
Adjustable Rate Mortgage/ARM
Purchase Details
Closed on
Sep 6, 2005
Sold by
Johns Randal
Bought by
Moutos Chris
Create a Home Valuation Report for This Property
The Home Valuation Report is an in-depth analysis detailing your home's value as well as a comparison with similar homes in the area
Home Values in the Area
Average Home Value in this Area
Purchase History
| Date | Buyer | Sale Price | Title Company |
|---|---|---|---|
| Koinis Gerald T | $412,000 | None Available | |
| Redwine Nash E | $216,000 | -- | |
| Moutos Chris | -- | -- |
Source: Public Records
Mortgage History
| Date | Status | Borrower | Loan Amount |
|---|---|---|---|
| Open | Koinis Gerald T | $209,000 | |
| Previous Owner | Redwine Nash E | $169,400 |
Source: Public Records
Tax History Compared to Growth
Tax History
| Year | Tax Paid | Tax Assessment Tax Assessment Total Assessment is a certain percentage of the fair market value that is determined by local assessors to be the total taxable value of land and additions on the property. | Land | Improvement |
|---|---|---|---|---|
| 2025 | $4,555 | $390,877 | $71,237 | $319,640 |
| 2024 | $4,555 | $390,877 | $71,237 | $319,640 |
| 2023 | $4,553 | $269,048 | $56,951 | $212,097 |
| 2022 | $4,007 | $269,048 | $56,951 | $212,097 |
| 2021 | $4,002 | $269,048 | $56,951 | $212,097 |
| 2020 | $4,002 | $269,048 | $56,951 | $212,097 |
| 2019 | $4,002 | $269,048 | $56,951 | $212,097 |
| 2018 | $4,002 | $269,048 | $56,951 | $212,097 |
| 2016 | $4,000 | $261,852 | $57,797 | $204,055 |
| 2015 | $3,864 | $261,852 | $57,797 | $204,055 |
| 2014 | $3,864 | $261,852 | $57,797 | $204,055 |
| 2013 | -- | $261,852 | $57,797 | $204,055 |
Source: Public Records
Map
Nearby Homes
- 125 Pine Cone Dr
- 123 Pine Cone Dr
- 128 Pine Cone Dr
- 136 Pine Cone Dr
- 136 Pine Cone Dr
- 127 Pine Cone Dr
- 127 Pine Cone Dr
- 121 Pine Cone Dr
- 129 Pine Cone Dr
- 126 Pine Cone Dr
- 126 Pine Cone Dr
- 117 Pine Cone Dr
- 144 Pine Cone Dr
- 115 Pine Cone Dr
- 131 Pine Cone Dr
- 113 Pine Cone Dr
- 124 Pine Cone Dr
- 111 Pine Cone Dr
- 158 Pine Cone Dr
- 157 Pine Cone Dr