Estimated Value: $467,000 - $529,000
6
Beds
4
Baths
3,496
Sq Ft
$146/Sq Ft
Est. Value
About This Home
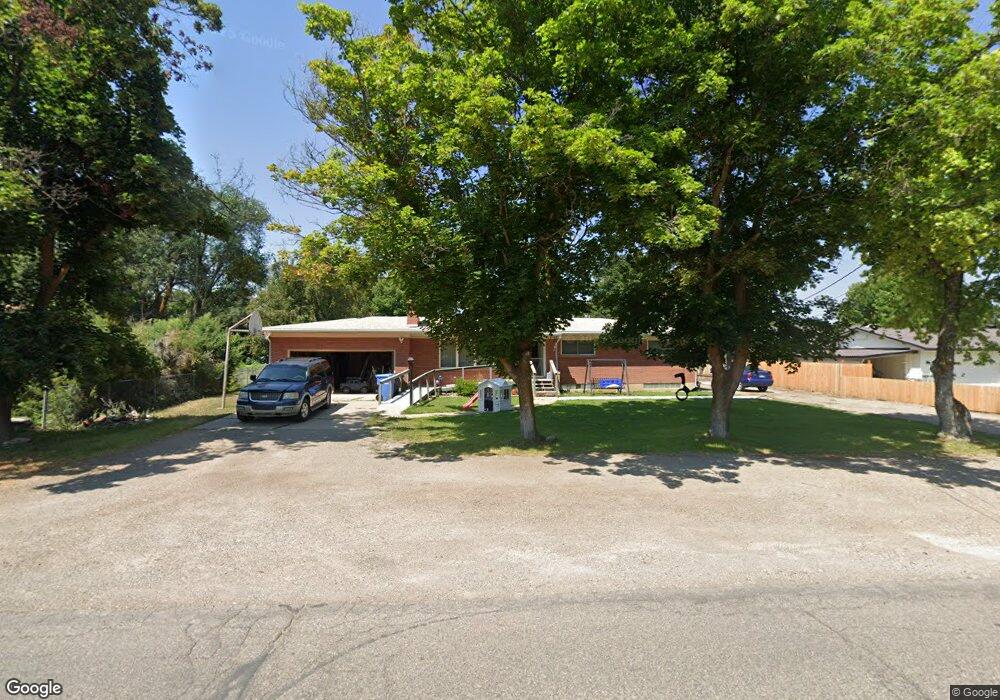
This home is located at 130 S 200 E, Hyrum, UT 84319 and is currently estimated at $509,055, approximately $145 per square foot. 130 S 200 E is a home located in Cache County with nearby schools including Lincoln School, South Cache Middle School, and Mountain Crest High School.
Ownership History
Date
Name
Owned For
Owner Type
Purchase Details
Closed on
Apr 25, 2023
Sold by
Atkinson Albert Ladell
Bought by
Atkinson Linda
Current Estimated Value
Purchase Details
Closed on
Jan 20, 2009
Sold by
Atkinson A La Dell and Atkinson Linda A
Bought by
Atkinson A La Dell
Home Financials for this Owner
Home Financials are based on the most recent Mortgage that was taken out on this home.
Original Mortgage
$237,240
Interest Rate
4.91%
Mortgage Type
FHA
Create a Home Valuation Report for This Property
The Home Valuation Report is an in-depth analysis detailing your home's value as well as a comparison with similar homes in the area
Home Values in the Area
Average Home Value in this Area
Purchase History
| Date | Buyer | Sale Price | Title Company |
|---|---|---|---|
| Atkinson Linda | -- | None Listed On Document | |
| Atkinson A La Dell | -- | First American Title Ins |
Source: Public Records
Mortgage History
| Date | Status | Borrower | Loan Amount |
|---|---|---|---|
| Previous Owner | Atkinson A La Dell | $237,240 |
Source: Public Records
Tax History
| Year | Tax Paid | Tax Assessment Tax Assessment Total Assessment is a certain percentage of the fair market value that is determined by local assessors to be the total taxable value of land and additions on the property. | Land | Improvement |
|---|---|---|---|---|
| 2025 | $2,018 | $289,795 | $0 | $0 |
| 2024 | $2,185 | $293,025 | $0 | $0 |
| 2023 | $2,076 | $266,125 | $0 | $0 |
| 2022 | $2,166 | $266,130 | $0 | $0 |
| 2021 | $1,993 | $374,520 | $66,660 | $307,860 |
| 2020 | $1,709 | $302,360 | $66,660 | $235,700 |
| 2019 | $1,674 | $278,380 | $42,680 | $235,700 |
| 2018 | $1,355 | $217,556 | $42,680 | $174,876 |
| 2017 | $1,314 | $110,115 | $0 | $0 |
| 2016 | $1,344 | $110,115 | $0 | $0 |
| 2015 | $1,347 | $110,115 | $0 | $0 |
| 2014 | $1,315 | $109,950 | $0 | $0 |
| 2013 | -- | $82,810 | $0 | $0 |
Source: Public Records
Map
Nearby Homes