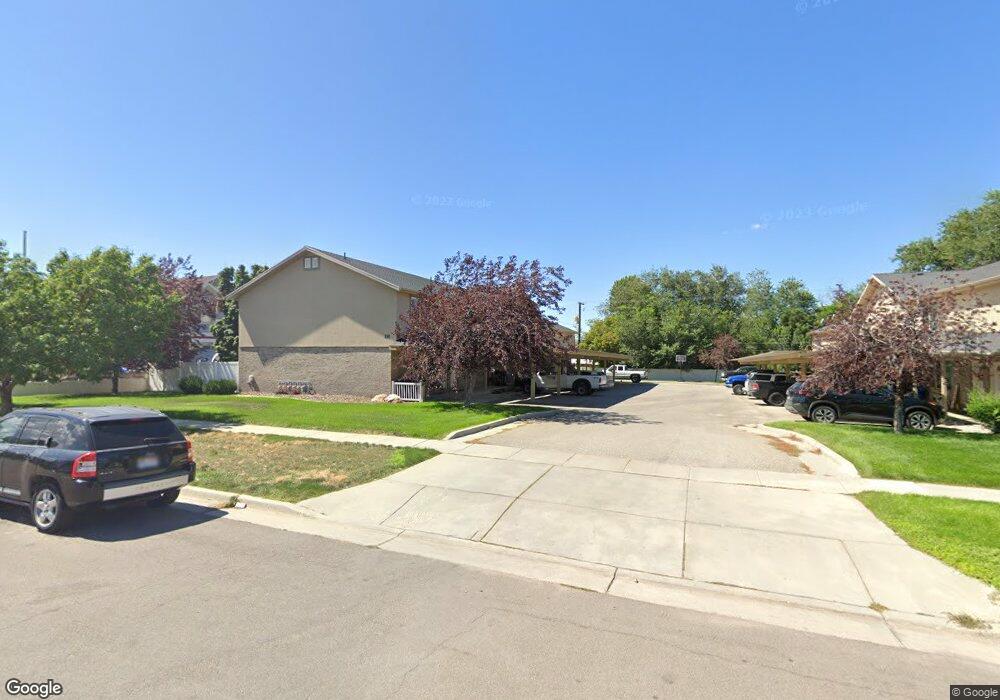
130 S 200 W Unit 6 Brigham City, UT 84302
Estimated Value: $281,145 - $325,000
3
Beds
2
Baths
1,312
Sq Ft
$231/Sq Ft
Est. Value
About This Home
This home is located at 130 S 200 W Unit 6, Brigham City, UT 84302 and is currently estimated at $302,536, approximately $230 per square foot. 130 S 200 W Unit 6 is a home located in Box Elder County with nearby schools including Lake View Elementary School, Box Elder Middle School, and Adele C. Young Intermediate School.
Ownership History
Date
Name
Owned For
Owner Type
Purchase Details
Closed on
Nov 20, 2018
Sold by
Lapierre Michelle A and Arrington Michelle
Bought by
Lapierre Michelle A
Current Estimated Value
Purchase Details
Closed on
Dec 17, 2015
Sold by
Pantoja Jose R and Gomez Misty R
Bought by
Arrington Michelle
Home Financials for this Owner
Home Financials are based on the most recent Mortgage that was taken out on this home.
Original Mortgage
$87,200
Outstanding Balance
$36,336
Interest Rate
3.83%
Mortgage Type
New Conventional
Estimated Equity
$266,200
Purchase Details
Closed on
Jul 30, 2009
Sold by
Pantoja Jose H
Bought by
Pantoja Jose Roman and Gomez Misty R
Home Financials for this Owner
Home Financials are based on the most recent Mortgage that was taken out on this home.
Original Mortgage
$110,450
Interest Rate
5.31%
Mortgage Type
New Conventional
Create a Home Valuation Report for This Property
The Home Valuation Report is an in-depth analysis detailing your home's value as well as a comparison with similar homes in the area
Home Values in the Area
Average Home Value in this Area
Purchase History
| Date | Buyer | Sale Price | Title Company |
|---|---|---|---|
| Lapierre Michelle A | -- | Phillips Hansen Land Title C | |
| Arrington Michelle | -- | American Secure Title Tremon | |
| Pantoja Jose Roman | -- | -- | |
| Pantoja Jose R | -- | -- |
Source: Public Records
Mortgage History
| Date | Status | Borrower | Loan Amount |
|---|---|---|---|
| Open | Arrington Michelle | $87,200 | |
| Previous Owner | Pantoja Jose R | $110,450 |
Source: Public Records
Tax History Compared to Growth
Tax History
| Year | Tax Paid | Tax Assessment Tax Assessment Total Assessment is a certain percentage of the fair market value that is determined by local assessors to be the total taxable value of land and additions on the property. | Land | Improvement |
|---|---|---|---|---|
| 2025 | $1,221 | $236,343 | $70,000 | $166,343 |
| 2024 | $1,221 | $235,096 | $65,000 | $170,096 |
| 2023 | $1,144 | $225,544 | $50,000 | $175,544 |
| 2022 | $1,353 | $136,355 | $5,500 | $130,855 |
| 2021 | $1,042 | $166,327 | $10,000 | $156,327 |
| 2020 | $1,024 | $166,327 | $10,000 | $156,327 |
| 2019 | $944 | $81,589 | $5,500 | $76,089 |
| 2018 | $834 | $71,664 | $5,500 | $66,164 |
| 2017 | $707 | $105,152 | $1,650 | $102,152 |
| 2016 | $733 | $55,158 | $1,650 | $53,508 |
| 2015 | $662 | $50,294 | $1,650 | $48,644 |
| 2014 | $662 | $47,978 | $1,650 | $46,328 |
| 2013 | -- | $47,978 | $1,650 | $46,328 |
Source: Public Records
Map
Nearby Homes
- 130 S 200 W Unit 7
- 130 S 200 W Unit 4
- 130 S 200 W Unit 12
- 130 S 200 W Unit 10
- 130 S 200 W Unit 9
- 130 S 200 W Unit 8
- 130 S 200 W Unit 5
- 130 S 200 W Unit 3
- 130 S 200 W Unit 1
- 130 S 200 W Unit 2
- 130 S 200 W
- 130 S 200 W Unit 11
- 144 S 200 W
- 143 S 300 W
- 150 S 200 W
- 127 S 300 W
- 153 S 300 W
- 121 S 300 W
- 112 S 200 W
- 108 S 200 W