
Seller's Agent in 2018
Linda Turpin
Re/Max Of Albany
(229) 881-1529
107 Total Sales
Estimated Value: $586,000 - $688,000
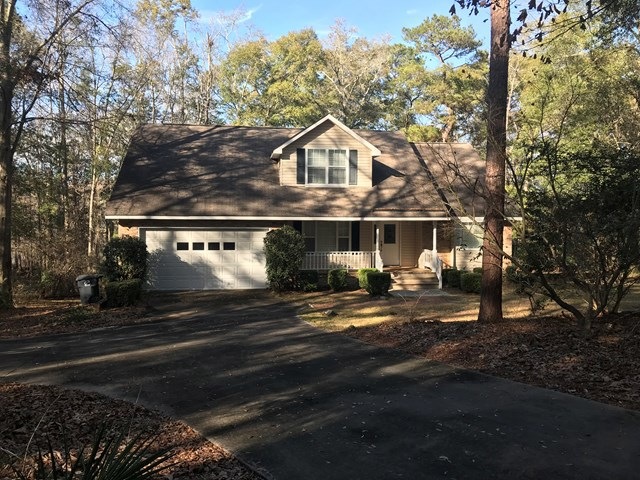
Beautiful Lake Blackshear Retreat with a winding wooded entrance with beautiful moss covered trees on 1.26 acre lot. The gorgeous home offers 3166 sq ft of living space on the waterfront of Lake Blackshear. You must see this one to appreciate the view and all the space. The great room offers vaulted ceilings and a gorgeous view of the water and a screen porch to extend the living area. This is a perfect home for entertaining with the large den and kitchen connected. Large spacious kitchen with a breakfast area that opens onto a deck with a great view of the water. This home features 4 bedrooms, 2 1/2 baths with a large master downstairs and the rest upstairs. This home will provide plenty of space for large gatherings . Below the screen porch is a basement that is great for storage and a 30 x 50 dock with 2 boat slips. Call today for your showing.
Last Agent to Sell the Property
Re/Max Of Albany Brokerage Phone: 2294341600 License #162005 Listed on: 03/06/2018
| Date | Buyer | Sale Price | Title Company |
|---|---|---|---|
| Burns Ryan D | $310,000 | -- | |
| Hunter Kenneth C | -- | -- | |
| Hunter Kenneth C | $375,500 | -- | |
| Dillard Leonard A J | $202,500 | -- | |
| Creekside Builders | $42,000 | -- | |
| Wes Enterprises Inc | $25,000 | -- | |
| Smith William | $25,000 | -- |
| Date | Status | Borrower | Loan Amount |
|---|---|---|---|
| Open | Burns Ryan D | $310,000 | |
| Previous Owner | Hunter Kenneth C | $300,400 | |
| Previous Owner | Hunter Kenneth C | $56,325 |
| Date | Event | Price | List to Sale | Price per Sq Ft |
|---|---|---|---|---|
| 04/12/2018 04/12/18 | Sold | $310,000 | -- | $117 / Sq Ft |
| 03/06/2018 03/06/18 | Pending | -- | -- | -- |
| Year | Tax Paid | Tax Assessment Tax Assessment Total Assessment is a certain percentage of the fair market value that is determined by local assessors to be the total taxable value of land and additions on the property. | Land | Improvement |
|---|---|---|---|---|
| 2024 | $3,059 | $229,989 | $39,028 | $190,961 |
| 2023 | $2,051 | $183,021 | $39,028 | $143,993 |
| 2022 | $2,098 | $176,447 | $39,028 | $137,419 |
| 2021 | $2,056 | $144,679 | $39,028 | $105,651 |
| 2020 | $3,807 | $130,187 | $41,057 | $89,130 |
| 2019 | $3,600 | $130,187 | $41,057 | $89,130 |
| 2018 | $3,929 | $128,300 | $45,818 | $82,482 |
| 2017 | $3,945 | $128,300 | $45,818 | $82,482 |
| 2016 | $3,940 | $128,300 | $45,818 | $82,482 |
| 2015 | -- | $128,301 | $45,818 | $82,482 |
| 2014 | -- | $128,301 | $45,818 | $82,482 |
| 2013 | -- | $128,300 | $45,818 | $82,482 |
Seller's Agent in 2018
Linda Turpin
Re/Max Of Albany
(229) 881-1529
107 Total Sales
Buyer's Agent in 2018
Vickie Giles-Griffin
Re/Max Of Albany
120 Total Sales
Source: Albany Board of REALTORS®
MLS Number: 140237
APN: 007K-032