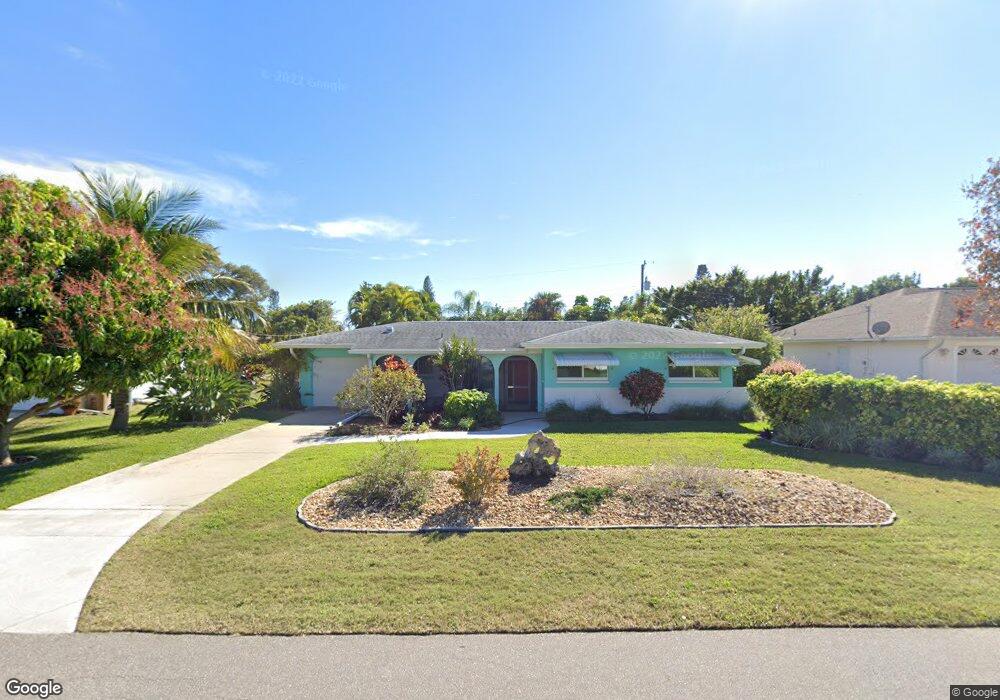
130 SE 43rd Terrace Unit 15 Cape Coral, FL 33904
Bimini Basin NeighborhoodEstimated Value: $273,000 - $402,000
3
Beds
2
Baths
1,829
Sq Ft
$180/Sq Ft
Est. Value
About This Home
This home is located at 130 SE 43rd Terrace Unit 15, Cape Coral, FL 33904 and is currently estimated at $328,774, approximately $179 per square foot. 130 SE 43rd Terrace Unit 15 is a home located in Lee County with nearby schools including Cape Elementary School, Caloosa Elementary School, and Tropic Isles Elementary School.
Ownership History
Date
Name
Owned For
Owner Type
Purchase Details
Closed on
Jan 18, 2013
Sold by
Rothwell Charles and Rothwell Christopher
Bought by
Parsons Linda and Parsons Randy
Current Estimated Value
Home Financials for this Owner
Home Financials are based on the most recent Mortgage that was taken out on this home.
Original Mortgage
$66,000
Outstanding Balance
$46,019
Interest Rate
3.43%
Mortgage Type
New Conventional
Estimated Equity
$282,756
Purchase Details
Closed on
Jun 14, 2005
Sold by
Carty Clara V
Bought by
Rothwell Charles W and Rothwell Christopher L
Home Financials for this Owner
Home Financials are based on the most recent Mortgage that was taken out on this home.
Original Mortgage
$172,000
Interest Rate
6.25%
Mortgage Type
Unknown
Purchase Details
Closed on
Mar 3, 1995
Sold by
Queen James W and Queen Illa Kay
Bought by
Carty Clara V
Home Financials for this Owner
Home Financials are based on the most recent Mortgage that was taken out on this home.
Original Mortgage
$62,000
Interest Rate
9.05%
Create a Home Valuation Report for This Property
The Home Valuation Report is an in-depth analysis detailing your home's value as well as a comparison with similar homes in the area
Home Values in the Area
Average Home Value in this Area
Purchase History
| Date | Buyer | Sale Price | Title Company |
|---|---|---|---|
| Parsons Linda | $82,500 | Allegiance Title Of America | |
| Rothwell Charles W | $215,000 | First Cmnty Title Svcs Inc | |
| Carty Clara V | $91,000 | -- |
Source: Public Records
Mortgage History
| Date | Status | Borrower | Loan Amount |
|---|---|---|---|
| Open | Parsons Linda | $66,000 | |
| Previous Owner | Rothwell Charles W | $172,000 | |
| Previous Owner | Carty Clara V | $62,000 |
Source: Public Records
Tax History Compared to Growth
Tax History
| Year | Tax Paid | Tax Assessment Tax Assessment Total Assessment is a certain percentage of the fair market value that is determined by local assessors to be the total taxable value of land and additions on the property. | Land | Improvement |
|---|---|---|---|---|
| 2025 | $4,550 | $259,394 | -- | -- |
| 2024 | $5,436 | $235,813 | $59,909 | $134,833 |
| 2023 | $5,436 | $293,674 | $46,169 | $211,383 |
| 2022 | $5,915 | $332,383 | $38,024 | $294,359 |
| 2021 | $2,296 | $231,100 | $29,412 | $201,688 |
| 2020 | $2,288 | $136,788 | $0 | $0 |
| 2019 | $2,211 | $133,713 | $0 | $0 |
| 2018 | $2,194 | $131,220 | $0 | $0 |
| 2017 | $2,149 | $128,521 | $0 | $0 |
| 2016 | $2,104 | $161,418 | $21,560 | $139,858 |
| 2015 | $2,102 | $146,605 | $16,740 | $129,865 |
| 2014 | -- | $120,896 | $14,899 | $105,997 |
| 2013 | -- | $115,112 | $11,029 | $104,083 |
Source: Public Records
Map
Nearby Homes
- 127 SE 43rd Ln
- 137 SE 44th Terrace
- 203 SE 43rd Terrace
- 108 SE 42nd Terrace
- 4402 Santa Barbara Blvd
- 101 SE 44th Terrace
- 133 SE 45th St
- 4412 Santa Barbara Blvd
- 4232 SW Santa Barbara Place
- 4224 SE 2nd Ave
- 4129 SE 1st Place
- 4132 Santa Barbara Blvd
- 4502 Santa Barbara Blvd
- 125 SE 41st Terrace
- 4128 Santa Barbara Blvd Unit 1-2
- 4508 Santa Barbara Blvd Unit 102
- 136 SE 45th Terrace
- 4426 SW Santa Barbara Place
- 101 SE 41st Terrace
- 4514 Santa Barbara Blvd Unit 5
- 130 SE 43rd Terrace
- 126 SE 43rd Terrace
- 134 SE 43rd Terrace
- 131 SE 43rd Ln
- 123 SE 43rd Ln
- 125 SE 43rd Terrace
- 135 SE 43rd Ln
- 133 SE 43rd Terrace
- 119 SE 43rd Ln
- 121 SE 43rd Terrace
- 137 SE 43rd Terrace
- 4301 SE 1st Ave Unit 10
- 4305 SE 1st Ave
- 116 SE 43rd Terrace
- 130 SE 43rd Ln
- 126 SE 43rd Ln
- 134 SE 43rd Ln
- 122 SE 43rd Ln
- 4309 SE 1st Ave