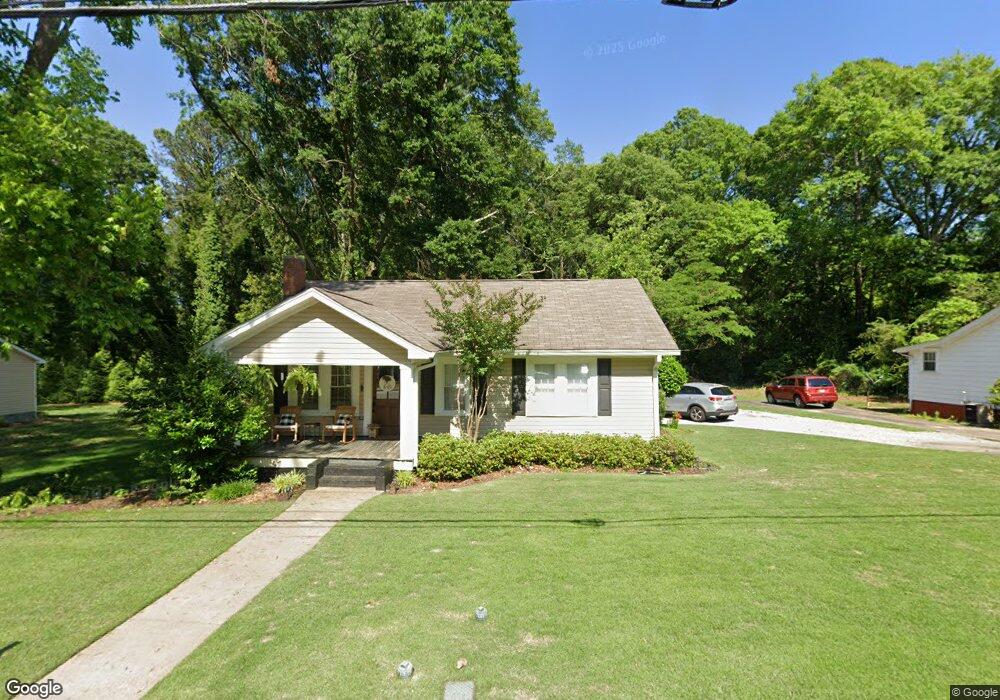
130 Tuggle St Carrollton, GA 30117
Estimated Value: $177,000 - $254,000
3
Beds
1
Bath
1,140
Sq Ft
$196/Sq Ft
Est. Value
About This Home
This home is located at 130 Tuggle St, Carrollton, GA 30117 and is currently estimated at $223,362, approximately $195 per square foot. 130 Tuggle St is a home located in Carroll County with nearby schools including Carrollton Elementary School, Carrollton Upper Elementary School, and Carrollton Middle School.
Ownership History
Date
Name
Owned For
Owner Type
Purchase Details
Closed on
Nov 30, 2015
Sold by
Coker Jonathan
Bought by
Payne Rebecca L
Current Estimated Value
Home Financials for this Owner
Home Financials are based on the most recent Mortgage that was taken out on this home.
Original Mortgage
$101,624
Outstanding Balance
$79,361
Interest Rate
3.5%
Mortgage Type
FHA
Estimated Equity
$144,001
Purchase Details
Closed on
Dec 11, 2006
Sold by
Not Provided
Bought by
Coker Jonathan and Coker Jeannette
Purchase Details
Closed on
Mar 31, 2000
Sold by
Thomasson Ii Frank T
Bought by
Thomasson Anne D
Purchase Details
Closed on
Dec 17, 1999
Sold by
Patterson Roger M
Bought by
Patterson Roger M
Purchase Details
Closed on
Oct 5, 1999
Sold by
Lankford
Bought by
United Companies Len
Create a Home Valuation Report for This Property
The Home Valuation Report is an in-depth analysis detailing your home's value as well as a comparison with similar homes in the area
Home Values in the Area
Average Home Value in this Area
Purchase History
| Date | Buyer | Sale Price | Title Company |
|---|---|---|---|
| Payne Rebecca L | $103,500 | -- | |
| Coker Jonathan | $111,700 | -- | |
| Thomasson Anne D | -- | -- | |
| Thomasson Ii Frank T | $79,400 | -- | |
| Patterson Roger M | -- | -- | |
| Patterson Roger M | $49,500 | -- | |
| United Companies Len | $52,400 | -- |
Source: Public Records
Mortgage History
| Date | Status | Borrower | Loan Amount |
|---|---|---|---|
| Open | Payne Rebecca L | $101,624 |
Source: Public Records
Tax History Compared to Growth
Tax History
| Year | Tax Paid | Tax Assessment Tax Assessment Total Assessment is a certain percentage of the fair market value that is determined by local assessors to be the total taxable value of land and additions on the property. | Land | Improvement |
|---|---|---|---|---|
| 2024 | $1,692 | $75,038 | $19,064 | $55,974 |
| 2023 | $1,692 | $70,011 | $19,064 | $50,947 |
| 2022 | $1,358 | $56,394 | $12,710 | $43,684 |
| 2021 | $1,141 | $46,956 | $9,407 | $37,549 |
| 2020 | $1,051 | $42,977 | $9,407 | $33,570 |
| 2019 | $986 | $39,806 | $9,407 | $30,399 |
| 2018 | $902 | $35,715 | $9,407 | $26,308 |
| 2017 | $906 | $35,715 | $9,407 | $26,308 |
| 2016 | $911 | $35,715 | $9,407 | $26,308 |
| 2015 | $1,052 | $34,052 | $4,000 | $30,052 |
| 2014 | $1,056 | $34,052 | $4,000 | $30,052 |
Source: Public Records
Map
Nearby Homes
- 516 Longview St
- 105 Haygood Place
- 219 Broad St
- 141 Bowen St
- 142 Griffin Dr
- 160 Watson St
- 166 Maple St
- 0 Hwy 27 None N
- 117 Orion Terrace
- 27 South St
- 109 S Park St
- 308 Old Mill Dr
- 301 Bradley St
- 98 Millstream Ct
- 301 C4 Bradley St
- 223 Sunset Blvd
- 74 Old Mill Ct
- TRACT1-7 Us Highway 27
- 1818 Maple St
- 205 Johnson Ave Unit 231
- 138 Tuggle St
- 124 Tuggle St
- 142 Tuggle St
- 118 Tuggle St
- 123 Tuggle St
- 135 Tuggle St
- 202 Tuggle St
- 109 Tuggle St
- 109 1/2 Tuggle St
- 924926 Maple St
- 206 Tuggle St
- 108 Tuggle St
- 102 Stonewall Dr
- 102 Stonewall Dr
- 105 Tuggle St
- 104 Tuggle St
- 924 Maple St Unit 926
- 924 Maple St
- 924 Maple St
- 0 Tuggle St Unit 8423813