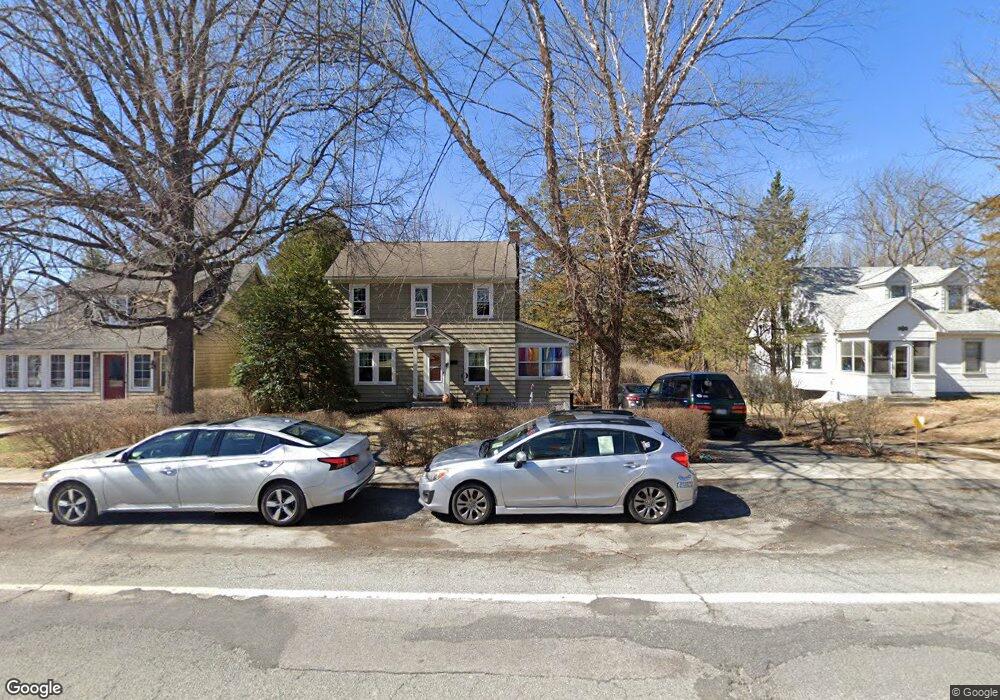
130 Union St Montgomery, NY 12549
Estimated Value: $371,000 - $400,000
3
Beds
1
Bath
1,232
Sq Ft
$314/Sq Ft
Est. Value
About This Home
This home is located at 130 Union St, Montgomery, NY 12549 and is currently estimated at $386,395, approximately $313 per square foot. 130 Union St is a home located in Orange County with nearby schools including Valley Central High School and Montgomery Montessori School.
Ownership History
Date
Name
Owned For
Owner Type
Purchase Details
Closed on
Jul 29, 1998
Sold by
Felter Robert C
Bought by
Campbell Richard J and Campbell Valerie J
Current Estimated Value
Purchase Details
Closed on
Sep 4, 1997
Sold by
Goldsmith Manning Construction Corp
Bought by
Gillette William C and Gillette Nancy J
Purchase Details
Closed on
Nov 21, 1995
Sold by
Hauser John F and Kanaley Ellen M
Bought by
Melvin Gail M
Purchase Details
Closed on
Jun 2, 1994
Sold by
Fern Associates
Bought by
Mighton Charlotte
Create a Home Valuation Report for This Property
The Home Valuation Report is an in-depth analysis detailing your home's value as well as a comparison with similar homes in the area
Home Values in the Area
Average Home Value in this Area
Purchase History
| Date | Buyer | Sale Price | Title Company |
|---|---|---|---|
| Campbell Richard J | $116,500 | -- | |
| Gillette William C | $215,000 | Fidelity National Title Ins | |
| Melvin Gail M | $105,000 | Commonwealth Land Title Ins | |
| Mighton Charlotte | $111,000 | -- |
Source: Public Records
Tax History Compared to Growth
Tax History
| Year | Tax Paid | Tax Assessment Tax Assessment Total Assessment is a certain percentage of the fair market value that is determined by local assessors to be the total taxable value of land and additions on the property. | Land | Improvement |
|---|---|---|---|---|
| 2024 | $7,776 | $124,900 | $23,300 | $101,600 |
| 2023 | $7,776 | $124,900 | $23,300 | $101,600 |
| 2022 | $7,742 | $124,900 | $23,300 | $101,600 |
| 2021 | $7,721 | $124,900 | $23,300 | $101,600 |
| 2020 | $7,754 | $124,900 | $23,300 | $101,600 |
| 2019 | $7,564 | $124,900 | $23,300 | $101,600 |
| 2018 | $7,564 | $124,900 | $23,300 | $101,600 |
| 2017 | $7,342 | $124,900 | $23,300 | $101,600 |
| 2016 | $7,239 | $124,900 | $23,300 | $101,600 |
| 2015 | -- | $124,900 | $23,300 | $101,600 |
| 2014 | -- | $124,900 | $23,300 | $101,600 |
Source: Public Records
Map
Nearby Homes