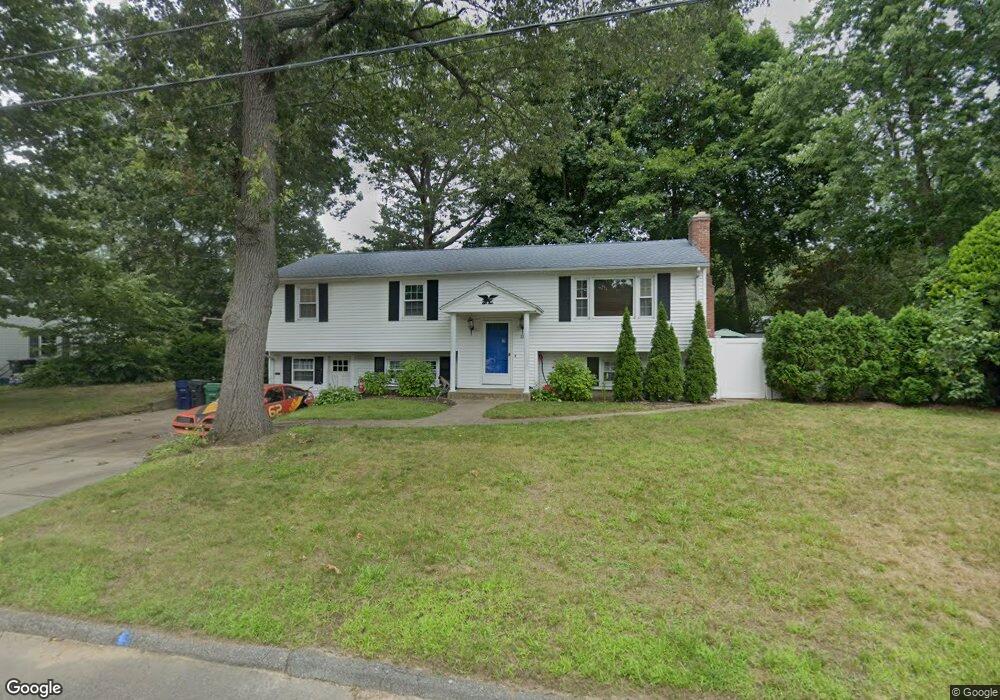
130 Viscount Rd Warwick, RI 02889
Conimicut-Shawomet NeighborhoodEstimated Value: $421,075 - $488,000
3
Beds
2
Baths
1,250
Sq Ft
$359/Sq Ft
Est. Value
About This Home
This home is located at 130 Viscount Rd, Warwick, RI 02889 and is currently estimated at $449,019, approximately $359 per square foot. 130 Viscount Rd is a home located in Kent County with nearby schools including Saint Kevin School and Bishop Hendricken High School.
Ownership History
Date
Name
Owned For
Owner Type
Purchase Details
Closed on
Dec 10, 2021
Sold by
Gruneberg Raymond and Gruneberg Claire R
Bought by
Gruneberg Kurt S and Gruneberg Kendra D
Current Estimated Value
Purchase Details
Closed on
Aug 26, 1992
Sold by
Norman Thomas R and Norman Elizabeth
Bought by
Gruneberg Raymond and Gruneberg Claire
Create a Home Valuation Report for This Property
The Home Valuation Report is an in-depth analysis detailing your home's value as well as a comparison with similar homes in the area
Home Values in the Area
Average Home Value in this Area
Purchase History
| Date | Buyer | Sale Price | Title Company |
|---|---|---|---|
| Gruneberg Kurt S | -- | None Available | |
| Gruneberg Raymond | $150,000 | -- | |
| Gruneberg Raymond | $150,000 | -- |
Source: Public Records
Mortgage History
| Date | Status | Borrower | Loan Amount |
|---|---|---|---|
| Previous Owner | Gruneberg Raymond | $125,000 | |
| Previous Owner | Gruneberg Raymond | $85,000 | |
| Previous Owner | Gruneberg Raymond | $139,700 | |
| Previous Owner | Gruneberg Raymond | $100,000 |
Source: Public Records
Tax History
| Year | Tax Paid | Tax Assessment Tax Assessment Total Assessment is a certain percentage of the fair market value that is determined by local assessors to be the total taxable value of land and additions on the property. | Land | Improvement |
|---|---|---|---|---|
| 2025 | $5,403 | $425,400 | $112,500 | $312,900 |
| 2024 | $5,337 | $368,800 | $97,800 | $271,000 |
| 2023 | $5,233 | $368,800 | $97,800 | $271,000 |
| 2022 | $4,915 | $262,400 | $58,200 | $204,200 |
| 2021 | $4,915 | $262,400 | $58,200 | $204,200 |
| 2020 | $4,915 | $262,400 | $58,200 | $204,200 |
| 2019 | $4,915 | $262,400 | $58,200 | $204,200 |
| 2018 | $4,254 | $204,500 | $58,200 | $146,300 |
| 2017 | $4,139 | $204,500 | $58,200 | $146,300 |
| 2016 | $4,139 | $204,500 | $58,200 | $146,300 |
| 2015 | $3,882 | $187,100 | $62,900 | $124,200 |
| 2014 | $3,753 | $187,100 | $62,900 | $124,200 |
| 2013 | $3,703 | $187,100 | $62,900 | $124,200 |
Source: Public Records
Map
Nearby Homes
- 103 Brightside Ave
- 2 Overbrook Ave
- 355 Church Ave
- 35 Transit St
- 17 Ardway Ave
- 404 Church Ave
- 2 Lachance Ave
- 20 Killey Ave
- 101 Farmland Rd
- 73 Eton Ave
- 37 Fulton St
- 28 Fulton St
- 29 Gibbons Ave
- 39 Damon Ave
- 52 Blake St
- 269 Bellman Ave
- 222 Killey Ave Unit 5
- 86 Bethel St
- 21 Chesterfield Ave
- 112 Old Warwick Ave
Your Personal Tour Guide
Ask me questions while you tour the home.