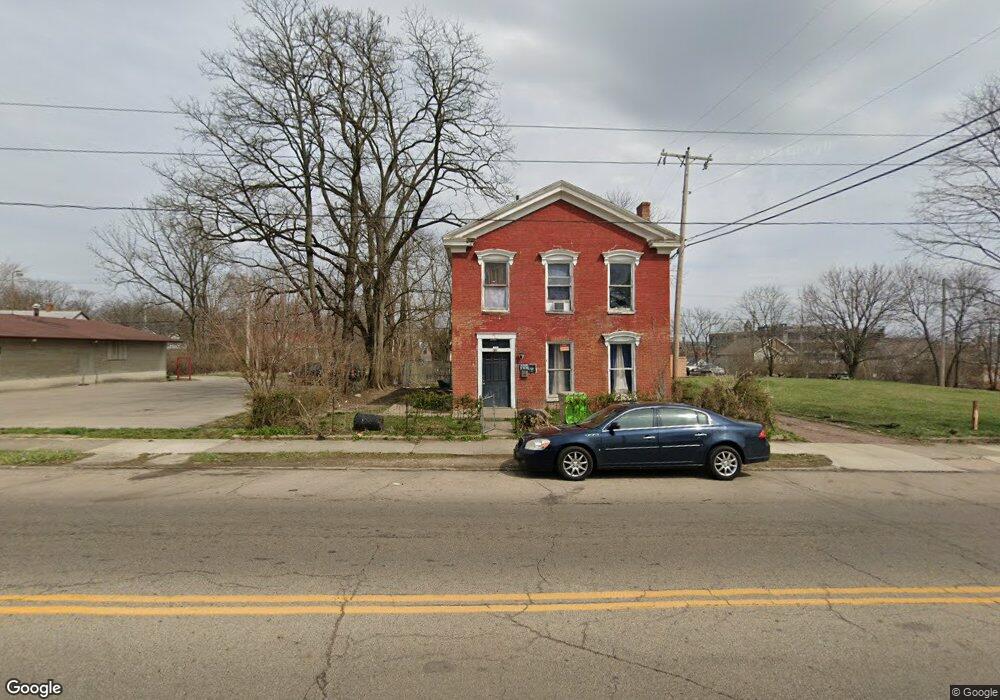
130 W Pleasant St Springfield, OH 45506
Estimated Value: $45,542 - $129,000
6
Beds
2
Baths
2,002
Sq Ft
$42/Sq Ft
Est. Value
About This Home
This home is located at 130 W Pleasant St, Springfield, OH 45506 and is currently estimated at $83,136, approximately $41 per square foot. 130 W Pleasant St is a home located in Clark County with nearby schools including Fulton Elementary School, Hayward Middle School, and Springfield High School.
Ownership History
Date
Name
Owned For
Owner Type
Purchase Details
Closed on
Aug 6, 2021
Sold by
Johnson Thomas
Bought by
Isalnd Investment Construction Llc
Current Estimated Value
Purchase Details
Closed on
Mar 2, 2018
Sold by
Krima Inc
Bought by
Johnson Thomas
Purchase Details
Closed on
Aug 18, 2010
Sold by
Hsbc Bank Usa
Bought by
Krima Inc
Purchase Details
Closed on
May 12, 2010
Sold by
Lowry Kasey S
Bought by
Hsbc Bank Usa
Purchase Details
Closed on
Jan 7, 1999
Sold by
City Loan Financial Services Inc
Bought by
Lowry Kasey S
Home Financials for this Owner
Home Financials are based on the most recent Mortgage that was taken out on this home.
Original Mortgage
$21,960
Interest Rate
6.76%
Mortgage Type
Purchase Money Mortgage
Create a Home Valuation Report for This Property
The Home Valuation Report is an in-depth analysis detailing your home's value as well as a comparison with similar homes in the area
Home Values in the Area
Average Home Value in this Area
Purchase History
| Date | Buyer | Sale Price | Title Company |
|---|---|---|---|
| Isalnd Investment Construction Llc | -- | None Available | |
| Island Investment Construction Llc | -- | Johnson Thomas | |
| Johnson Thomas | $12,300 | None Available | |
| Krima Inc | $5,000 | Attorney | |
| Hsbc Bank Usa | $12,000 | None Available | |
| Lowry Kasey S | $25,000 | -- |
Source: Public Records
Mortgage History
| Date | Status | Borrower | Loan Amount |
|---|---|---|---|
| Previous Owner | Lowry Kasey S | $21,960 |
Source: Public Records
Tax History Compared to Growth
Tax History
| Year | Tax Paid | Tax Assessment Tax Assessment Total Assessment is a certain percentage of the fair market value that is determined by local assessors to be the total taxable value of land and additions on the property. | Land | Improvement |
|---|---|---|---|---|
| 2024 | $627 | $10,630 | $1,100 | $9,530 |
| 2023 | $1,526 | $10,630 | $1,100 | $9,530 |
| 2022 | $2,251 | $10,630 | $1,100 | $9,530 |
| 2021 | $557 | $10,130 | $1,050 | $9,080 |
| 2020 | $558 | $10,130 | $1,050 | $9,080 |
| 2019 | $559 | $10,130 | $1,050 | $9,080 |
| 2018 | $304 | $5,280 | $1,050 | $4,230 |
| 2017 | $303 | $5,278 | $1,050 | $4,228 |
| 2016 | $304 | $5,278 | $1,050 | $4,228 |
| 2015 | $300 | $5,114 | $1,050 | $4,064 |
| 2014 | $299 | $5,114 | $1,050 | $4,064 |
| 2013 | $148 | $5,114 | $1,050 | $4,064 |
Source: Public Records
Map
Nearby Homes
- 702 S Wittenberg Ave
- 411 S Limestone St
- 317 S Plum St
- 738 S Center St Unit 740
- 38 W High St Unit 3B
- 516 W Clark St
- 20 N Center St
- 833 S Limestone St
- 25 Mill Run Place
- 634 Clifton Ave
- 638 Clifton Ave
- 0 S Plum St
- 644 Clifton Ave
- 681 W Jefferson St Unit 683
- 326 W Grand Ave
- 1029 S Fountain Ave
- 1019 S Limestone St
- 418 Linden Ave
- 35 E Grand Ave
- 31 W Southern Ave
- 124 W Pleasant St Unit 126
- 144 W Pleasant St
- 125 W Mulberry St
- 165 Pleasant St
- 129 W Pleasant St
- 112 W Pleasant St
- 112 W Pleasant St Unit 114
- 127 W Pleasant St
- 421 S Center St
- 412 S Wittenberg Ave
- 417 S Center St
- 119 W Mulberry St Unit 119
- 411 S Center St
- 108 W Pleasant St
- 508 S Wittenberg Ave Unit 510
- 510 S Wittenberg Ave Unit 1/2
- 515 Wiley Ave
- 514 S Wittenberg Ave
- 401 S Center St
- 520 S Wittenberg Ave